
Organic search drives between 30% and 50% of all ecommerce website traffic, making SEO the single largest source of visitors for most online stores. For business owners and marketing managers investing in long-term growth, understanding these numbers isn’t optional—it’s essential for making informed decisions about where to allocate budget and resources.
The ecommerce SEO landscape has shifted dramatically. Mobile searches now dominate, AI-powered search features are changing click behavior, and the gap between optimized and non-optimized stores continues to widen. These statistics reveal what’s actually working, what’s changing, and where the opportunities lie.
This comprehensive breakdown covers traffic benchmarks, conversion data, ROI comparisons, technical requirements, and industry-specific performance metrics. You’ll find the data you need to set realistic expectations, build a stronger SEO strategy, and measure success accurately.
Key Ecommerce SEO Statistics You Need to Know in 2026
The foundation of any ecommerce SEO strategy starts with understanding baseline performance metrics. These statistics establish what “normal” looks like across the industry and help you benchmark your own store’s performance against realistic standards.
Organic Search Traffic Statistics for Ecommerce
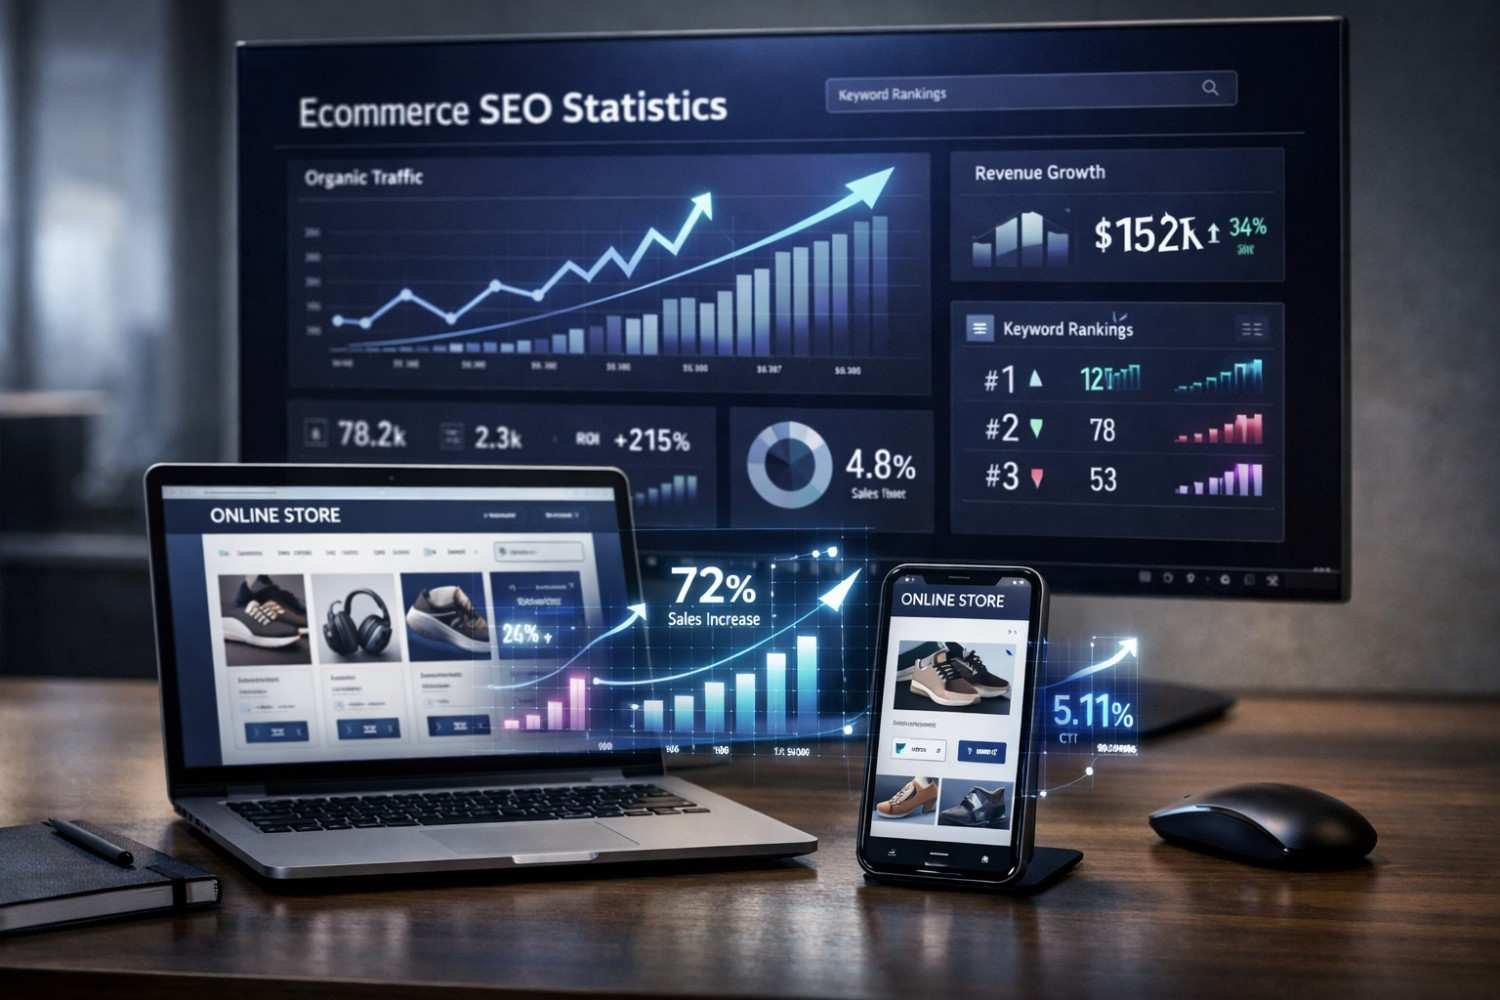
Organic search remains the dominant traffic source for ecommerce websites. BrightEdge research shows that 53% of all website traffic comes from organic search, with ecommerce sites typically seeing between 30% and 50% of their total visitors arriving through unpaid search results.
The distribution varies significantly by store maturity and optimization level. Newer ecommerce sites often see organic traffic represent just 10% to 20% of total visits, while established stores with strong SEO foundations regularly exceed 40%. This gap represents both the challenge and the opportunity.
Google dominates the search landscape, accounting for 91.5% of global search engine market share according to StatCounter. For practical purposes, ecommerce SEO means Google SEO, though Bing’s integration with AI tools is worth monitoring.
Ecommerce Conversion Rate Statistics from SEO
Organic traffic doesn’t just bring volume—it brings qualified buyers. FirstPageSage data indicates that organic search traffic converts at an average of 2.8% for ecommerce, compared to 1.3% for social media and 1.8% for display advertising.
The quality difference becomes more apparent when examining revenue per session. Organic visitors typically spend more time on site, view more products, and complete purchases at higher average order values. This isn’t accidental—people who search for specific products have clearer purchase intent than those who stumble across ads.
Top-performing ecommerce sites achieve organic conversion rates between 3% and 5%. The difference often comes down to landing page optimization, site speed, and how well product pages match search intent.
Mobile Ecommerce SEO Statistics
Mobile commerce has fundamentally changed ecommerce SEO requirements. Statista reports that 60% of ecommerce sales now occur on mobile devices, with that percentage climbing annually.
Google’s mobile-first indexing means your mobile site is your primary site in Google’s eyes. Sites that fail Core Web Vitals on mobile face ranking disadvantages regardless of desktop performance. Google’s own data confirms that page experience signals directly impact search visibility.
Mobile bounce rates for ecommerce sites average 47%, compared to 32% on desktop. Every second of load time delay increases mobile bounce rates by approximately 7%. For stores generating significant mobile traffic, these numbers translate directly to lost revenue.
Ecommerce SEO ROI and Revenue Statistics
Understanding the financial return on SEO investment helps justify budgets and set appropriate expectations. These statistics demonstrate why organic search consistently outperforms other channels on a cost-per-acquisition basis.
Cost Per Acquisition: SEO vs Paid Advertising
The cost difference between organic and paid customer acquisition is substantial. Profitwell research shows that organic search delivers customers at 60% to 70% lower cost than paid advertising over a 24-month period.
Average cost-per-click for ecommerce keywords on Google Ads ranges from $1 to $3 for general retail terms, climbing to $5 to $15 for competitive categories like electronics, fashion, and health products. For high-volume stores, these costs accumulate rapidly.
SEO requires upfront investment but delivers compounding returns. A page that ranks well continues generating traffic without incremental cost per click. Paid advertising stops the moment you stop paying.
Average Revenue Generated from Organic Search
Organic search typically generates 30% to 40% of total ecommerce revenue for optimized stores. Wolfgang Digital’s research across hundreds of ecommerce clients found organic search consistently outperformed paid search in revenue contribution.
The revenue impact varies by product category and price point. High-consideration purchases—electronics, furniture, B2B products—show stronger organic revenue percentages because buyers research extensively before purchasing. Impulse-buy categories see more balanced channel distribution.
Stores investing consistently in SEO for 12+ months typically see organic revenue contribution increase by 15% to 25% compared to their starting baseline.
Long-Term ROI Statistics for Ecommerce SEO
SEO’s long-term ROI outperforms most marketing channels when measured over 2 to 3 years. Search Engine Journal analysis indicates that mature SEO programs deliver ROI between 275% and 1,220%, depending on industry and execution quality.
The compounding nature of SEO creates exponential returns over time. Content published today continues ranking and generating traffic for years. Backlinks accumulated strengthen domain authority, making future content easier to rank.
Stores that maintain consistent SEO investment for 36+ months report organic traffic growth rates of 50% to 200% compared to year one. The patience required is significant, but the payoff justifies the timeline.
Ecommerce Search Behavior Statistics
Understanding how consumers actually search for products reveals optimization opportunities. These behavioral statistics inform keyword strategy, content development, and site architecture decisions.
How Consumers Find Products Online
Product discovery happens across multiple touchpoints, but search engines remain central. Google’s consumer insights show that 49% of shoppers use Google to discover new products, making it the leading product discovery channel.
Amazon has become a significant product search competitor, with approximately 56% of product searches starting on Amazon rather than Google. However, Google captures earlier-stage research queries—”best running shoes for flat feet” versus “Nike Air Zoom Pegasus.”
The distinction matters for SEO strategy. Optimizing for informational and comparison queries captures shoppers before they’ve decided what to buy, influencing purchase decisions rather than just capturing existing demand.
Product Search Query Statistics
Product-related searches show distinct patterns that inform content strategy. Ahrefs data reveals that 70% of all search queries are long-tail keywords—specific, multi-word phrases with lower volume but higher conversion intent.
“Best” and “review” modifiers appear in millions of monthly product searches. Queries containing “best [product category]” convert at rates 2x to 3x higher than generic product searches because they indicate active purchase consideration.
Question-based product searches have grown significantly. “What,” “which,” and “how” queries related to products increased by 85% over the past five years, reflecting consumers’ desire for guidance before purchasing.
Zero-Click Search Impact on Ecommerce
Zero-click searches—where users get answers directly on the search results page—affect ecommerce visibility. SparkToro research found that approximately 65% of Google searches result in no click to any website.
For ecommerce, the impact is nuanced. Product searches with commercial intent still generate clicks because Google can’t fulfill the actual purchase. However, informational queries that previously drove traffic to buying guides and comparison content increasingly get answered in search results.
Featured snippets and AI Overviews now appear for many product-related queries. Optimizing for these positions becomes critical—if you’re not in the featured result, you may not get the click at all.
Technical SEO Statistics for Ecommerce Sites
Technical foundation determines whether content can rank at all. These statistics demonstrate the measurable impact of technical SEO factors on ecommerce performance.
Page Speed and Core Web Vitals Statistics
Page speed directly impacts both rankings and revenue. Google research shows that as page load time increases from 1 second to 3 seconds, bounce probability increases by 32%. At 5 seconds, bounce probability reaches 90%.
Core Web Vitals compliance correlates with ranking performance. Sites passing all three Core Web Vitals metrics—LCP, FID, and CLS—show measurably better rankings than failing sites in competitive categories.
The average ecommerce site loads in 3.8 seconds on mobile. Top-performing sites load in under 2 seconds. This gap represents both a competitive disadvantage for slow sites and an opportunity for those willing to invest in speed optimization.
Site Architecture and Crawlability Data
Ecommerce sites face unique crawlability challenges due to scale. Large catalogs with thousands of products require careful architecture to ensure Google can discover and index important pages.
Botify research across enterprise ecommerce sites found that Google typically crawls only 50% to 60% of available pages on large sites. Pages buried more than 4 clicks from the homepage see dramatically reduced crawl frequency.
Faceted navigation creates crawl budget issues. Sites with extensive filtering options can generate millions of URL variations, diluting crawl resources away from important product and category pages.
Structured Data Adoption Statistics
Structured data implementation remains underutilized despite clear benefits. Schema.org adoption studies show that only 30% to 40% of ecommerce sites implement product schema markup correctly.
Rich results—star ratings, price, availability—significantly impact click-through rates. Products with rich snippets see CTR improvements of 20% to 30% compared to standard listings.
Review schema, FAQ schema, and breadcrumb markup each provide additional visibility opportunities. Sites implementing comprehensive structured data capture more SERP real estate and provide clearer signals to search engines about page content.
Ecommerce Content and Keyword Statistics
Content strategy drives organic visibility for ecommerce. These statistics inform how to prioritize optimization efforts across product pages, category pages, and supporting content.
Product Page Optimization Statistics
Product pages represent the largest optimization opportunity for most ecommerce sites. Backlinko analysis found that product pages with 1,000+ words of unique content rank significantly better than thin product descriptions.
Duplicate content plagues ecommerce sites. Manufacturer descriptions used across multiple retailers create indexing issues. Sites with 80%+ unique product content show stronger organic performance than those relying on syndicated descriptions.
Product page titles containing the primary keyword in the first 60 characters show higher rankings for target terms. Including modifiers like brand name, size, or color captures long-tail variations.
Category Page SEO Performance Data
Category pages often drive more organic traffic than individual product pages. Ahrefs ecommerce studies show that category pages capture 2x to 5x more organic traffic than product pages on average.
The reason is search volume distribution. “Running shoes” gets searched far more than any individual running shoe model. Category pages targeting these head terms capture broader demand.
Optimized category pages include unique introductory content, clear product organization, and internal links to related categories. Thin category pages with only product grids underperform pages with 300+ words of contextual content.
Long-Tail Keyword Statistics for Ecommerce
Long-tail keywords represent the majority of ecommerce search opportunity. Moz research confirms that 70% of search traffic comes from long-tail queries, with ecommerce seeing even higher percentages due to product specificity.
Long-tail conversion rates exceed head terms significantly. A search for “women’s waterproof hiking boots size 8 wide” converts at rates 3x to 5x higher than “hiking boots” because intent is crystal clear.
Capturing long-tail traffic requires comprehensive product information, variant pages, and content addressing specific use cases. Sites that systematically target long-tail terms build traffic that compounds over time.
Link Building Statistics for Ecommerce SEO
Backlinks remain a primary ranking factor. These statistics demonstrate the relationship between link acquisition and ecommerce search performance.
Backlink Correlation with Ecommerce Rankings
The correlation between backlinks and rankings remains strong. Backlinko’s ranking factors study found that the #1 result in Google has 3.8x more backlinks than positions 2-10.
For ecommerce specifically, product pages rarely attract natural links. Category pages and blog content serve as link-building assets that pass authority to commercial pages through internal linking.
Domain authority correlates with overall organic visibility. Sites with Domain Rating above 50 (Ahrefs scale) consistently outrank lower-authority competitors for competitive ecommerce terms.
Authority Building Statistics for Online Stores
Building authority requires consistent effort over time. Ahrefs data shows that pages ranking in the top 10 are on average 2+ years old, reflecting the time required to accumulate authority signals.
Link velocity matters. Sites acquiring links at a steady rate outperform those with sporadic link building. Sudden spikes in backlinks can trigger algorithmic scrutiny.
Quality outweighs quantity significantly. A single link from a high-authority, relevant site provides more ranking benefit than dozens of low-quality directory links.
Ecommerce SEO Timeline and Results Statistics
Setting realistic expectations prevents premature strategy abandonment. These statistics establish what timeframes to expect for various SEO milestones.
How Long Does Ecommerce SEO Take to Work?
SEO results require patience. Ahrefs research found that only 5.7% of pages rank in the top 10 within one year of publication. The average top-10 page is 2+ years old.
Initial movement typically appears within 3 to 6 months of optimization efforts. Meaningful traffic increases usually require 6 to 12 months of consistent work. Competitive terms may take 12 to 24 months to achieve strong rankings.
New ecommerce sites face longer timelines than established domains. Domain age and existing authority significantly impact how quickly new content can rank.
Ranking Improvement Statistics by Timeframe
Ranking improvements follow predictable patterns. Most pages see initial ranking movement within 4 to 6 months of optimization, with continued improvement over the following 6 to 12 months.
The “sandbox” effect—where new sites struggle to rank regardless of content quality—typically lasts 3 to 6 months. During this period, focus on building authority and content rather than expecting immediate rankings.
Pages that reach page 2 within 6 months have a 70%+ probability of reaching page 1 within 12 months if optimization continues. Stalled rankings often indicate content quality or authority gaps.
Traffic Growth Benchmarks for Ecommerce Sites
Organic traffic growth rates vary by starting point and investment level. Sites beginning SEO programs typically see 20% to 50% traffic growth in year one, with acceleration in years two and three.
Established sites with existing authority can see faster results. Adding new optimized content to a strong domain often produces ranking improvements within 2 to 4 months.
Compounding growth is the goal. Sites maintaining consistent SEO investment for 3+ years often achieve 100% to 300% organic traffic growth compared to their starting baseline.
What Do These Statistics Mean for My Ecommerce Business?
Raw numbers only matter when translated into actionable strategy. The statistics above reveal several critical insights for ecommerce operators.
First, organic search represents your largest sustainable traffic opportunity. Paid advertising provides immediate results but requires continuous spending. SEO builds an asset that generates returns indefinitely.
Second, mobile optimization isn’t optional. With 60%+ of ecommerce traffic coming from mobile devices, sites that fail mobile performance standards lose the majority of their potential customers.
Third, patience is required but rewarded. The 12 to 24 month timeline for meaningful results filters out competitors unwilling to invest long-term. Those who persist capture compounding returns.
Fourth, technical foundation enables content success. The best content in the world won’t rank on a slow, poorly-structured site. Technical SEO investment pays dividends across all future content.
Ecommerce SEO Statistics by Industry
Performance benchmarks vary significantly across ecommerce verticals. Understanding industry-specific statistics helps set appropriate expectations.
Fashion and Apparel SEO Statistics
Fashion ecommerce faces intense competition and seasonal volatility. Organic search drives approximately 35% to 45% of traffic for established fashion retailers.
Visual search is growing in fashion. Pinterest data shows that 80% of Pinterest users have discovered new brands or products through visual search, with fashion leading adoption.
Seasonal keyword targeting is essential. Fashion-related searches spike 200% to 400% during peak seasons (back-to-school, holiday), requiring content planning months in advance.
Electronics and Technology Ecommerce Data
Electronics ecommerce sees high search volumes but intense competition. Product review and comparison content drives significant organic traffic, with “best” and “vs” queries showing strong conversion rates.
Technical specifications matter for electronics SEO. Detailed spec sheets, comparison tables, and compatibility information capture long-tail searches that generic descriptions miss.
Product lifecycle creates unique challenges. Electronics products become obsolete quickly, requiring content refresh strategies to maintain rankings as new models release.
Health and Beauty SEO Performance Statistics
Health and beauty ecommerce benefits from strong informational search demand. “How to” and ingredient-focused queries drive significant traffic to brands that invest in educational content.
YMYL (Your Money or Your Life) considerations apply to health products. Google applies stricter quality standards to health-related content, making E-E-A-T signals particularly important.
Influencer and review content performs well. User-generated content and authentic reviews build trust signals that both users and search engines value.
B2B Ecommerce SEO Statistics
B2B ecommerce shows different patterns than B2C. Search volumes are lower, but conversion values are significantly higher—often 10x to 100x B2C average order values.
Long-tail keywords dominate B2B search. Specific part numbers, technical specifications, and industry terminology drive qualified traffic that generic terms miss.
Content marketing ROI is particularly strong in B2B. Educational content addressing buyer questions throughout the sales cycle generates leads that convert at higher rates than paid advertising.
Ecommerce SEO Investment Statistics
Understanding typical investment levels helps with budget planning and vendor evaluation. These statistics establish market norms for SEO spending.
Average SEO Budget for Ecommerce Businesses
SEO budgets vary dramatically by company size and ambition. Borrell Associates research indicates that small ecommerce businesses typically spend $500 to $2,000 monthly on SEO, while mid-market companies invest $2,000 to $10,000 monthly.
Enterprise ecommerce operations often allocate $10,000 to $50,000+ monthly for comprehensive SEO programs including technical optimization, content production, and link building.
As a percentage of revenue, successful ecommerce companies typically invest 5% to 15% of marketing budget in SEO, with the percentage higher for companies prioritizing long-term growth over immediate returns.
In-House vs Agency SEO Cost Statistics
The in-house versus agency decision involves different cost structures. In-house SEO specialists command salaries ranging from $50,000 to $120,000 annually depending on experience and location, plus benefits and overhead.
Agency retainers for ecommerce SEO typically range from $2,500 to $15,000 monthly for comprehensive services. Specialized ecommerce agencies often charge premium rates due to platform-specific expertise.
Hybrid models are increasingly common. Many ecommerce companies maintain in-house SEO leadership while outsourcing specialized functions like link building or technical audits to agencies.
SEO Spending Trends for Online Retailers
SEO investment is increasing across the ecommerce sector. Gartner CMO surveys show that organic search remains a top-three marketing investment priority for digital-first companies.
The shift toward first-party data and privacy restrictions on paid advertising is driving increased SEO investment. Companies anticipating reduced paid advertising effectiveness are building organic channels as insurance.
Content investment specifically is growing. Ecommerce companies are allocating larger portions of SEO budgets to content production, recognizing that comprehensive content coverage drives sustainable organic growth.
Local SEO Statistics for Ecommerce
Local search impacts ecommerce even for online-only retailers. These statistics reveal opportunities at the intersection of local and ecommerce search.
Local Search Impact on Ecommerce Sales
Local search influences ecommerce purchasing behavior. Google data shows that 76% of people who search for something nearby on their smartphone visit a related business within a day.
For ecommerce with physical locations, local SEO drives both online and offline conversions. “Buy online, pick up in store” searches have grown significantly, creating opportunities for retailers with omnichannel capabilities.
Even pure-play ecommerce benefits from local signals. Location-based content and regional landing pages capture searches with local intent that national pages miss.
“Near Me” Search Statistics for Retail
“Near me” searches have exploded in volume. Google Trends data shows that “near me” searches have grown 500%+ over the past five years, with retail categories among the fastest-growing.
Mobile drives the majority of “near me” searches. Users searching on mobile devices expect immediate, location-relevant results—making mobile optimization essential for capturing this traffic.
For ecommerce, “near me” alternatives like “same day delivery” and “local shipping” capture similar intent. Optimizing for delivery-speed-related queries captures users seeking immediate fulfillment.
Voice Search and AI Statistics for Ecommerce
Emerging search technologies are reshaping ecommerce discovery. These statistics indicate where search is heading and how to prepare.
Voice Commerce Search Statistics
Voice search adoption continues growing, though commerce applications remain limited. eMarketer research indicates that 35%+ of US adults use voice assistants monthly, but only 10% to 15% have made purchases via voice.
Voice search queries tend toward informational and navigational intent. Product research queries—”what’s the best budget laptop”—are common, while direct purchase commands remain rare.
Optimizing for voice means optimizing for featured snippets and direct answers. Voice assistants pull responses from featured snippet content, making position zero increasingly valuable.
AI-Driven Search Impact on Ecommerce
AI Overviews and similar features are changing search result pages. Google’s AI Overviews now appear for many product-related queries, synthesizing information from multiple sources.
Early data suggests AI Overviews reduce clicks for informational queries while maintaining or increasing clicks for transactional queries. Users still need to visit sites to make purchases.
Preparing for AI search means creating comprehensive, authoritative content that AI systems cite as sources. Structured data, clear information architecture, and factual accuracy become more important as AI mediates search results.
Ecommerce SEO vs Other Marketing Channels
Comparing SEO to alternative channels helps with budget allocation decisions. These statistics demonstrate relative performance across marketing options.
SEO vs PPC Statistics for Ecommerce
SEO and PPC serve different functions with different economics. WordStream data shows that PPC conversion rates for ecommerce average 1.9%, compared to 2.8% for organic search.
The cost difference is substantial over time. PPC requires continuous spending to maintain traffic, while SEO investment builds lasting assets. Over 24 to 36 months, SEO typically delivers 3x to 5x better ROI than equivalent PPC spending.
The optimal approach combines both channels. PPC provides immediate visibility while SEO builds, then SEO reduces dependence on paid traffic as organic rankings improve.
SEO vs Social Media Traffic Statistics
Social media drives brand awareness but limited direct traffic for most ecommerce sites. Shopify data indicates that social media accounts for 5% to 10% of ecommerce traffic on average, compared to 30% to 50% from organic search.
Social media conversion rates lag behind search. Users on social platforms are typically not in active shopping mode, resulting in lower purchase intent than search visitors.
Social media’s value lies in brand building and content amplification rather than direct traffic generation. Strong social presence can indirectly support SEO through brand search volume and content sharing.
Multi-Channel Attribution Statistics
Attribution complexity makes channel comparison difficult. Google Analytics data shows that the average ecommerce purchase involves 2.5 to 4 touchpoints across multiple channels.
Organic search often appears in the middle of conversion paths rather than as the final click. Last-click attribution undervalues SEO’s contribution to conversions that complete through other channels.
Multi-touch attribution models show SEO contributing 15% to 30% more value than last-click models suggest. Understanding this helps justify SEO investment that might appear underperforming in simplistic reporting.
How to Use These Ecommerce SEO Statistics
Data only creates value when applied to strategy. These frameworks help translate statistics into actionable plans.
Setting Realistic SEO Expectations
Use timeline statistics to set appropriate expectations with stakeholders. Communicating that meaningful results require 6 to 12 months prevents premature strategy abandonment.
Benchmark your current performance against industry averages. If organic traffic represents 15% of your total when the industry average is 35%, you have significant upside potential.
Set incremental milestones rather than focusing only on end goals. Tracking ranking improvements, traffic growth rates, and conversion changes provides early indicators of strategy effectiveness.
Building a Data-Driven SEO Strategy
Prioritize based on opportunity size. If mobile traffic converts poorly compared to benchmarks, mobile optimization offers clear ROI. If category pages underperform, content investment there makes sense.
Allocate budget according to proven returns. Statistics showing 60% to 70% lower acquisition costs from SEO justify shifting budget from paid channels to organic investment.
Test and measure continuously. Industry statistics provide benchmarks, but your specific results matter most. Track your own conversion rates, traffic growth, and ROI to refine strategy over time.
Measuring Ecommerce SEO Success
Track metrics that align with business outcomes. Traffic growth matters, but revenue from organic search matters more. Conversion rate improvements indicate optimization effectiveness.
Compare performance to industry benchmarks regularly. If your organic conversion rate is 1.5% when the industry average is 2.8%, landing page optimization should be prioritized.
Measure SEO ROI over appropriate timeframes. Monthly ROI calculations will show poor returns during the investment phase. Evaluate SEO performance over 12 to 24 month periods to capture true returns.
Conclusion: What Ecommerce SEO Statistics Reveal About Organic Growth
The data is clear: organic search represents the largest sustainable traffic and revenue opportunity for ecommerce businesses. With 30% to 50% of traffic, 2.8% average conversion rates, and 60% to 70% lower acquisition costs than paid advertising, SEO delivers returns that compound over time.
Success requires patience, technical foundation, and consistent investment. The 12 to 24 month timeline filters out competitors unwilling to commit, creating lasting advantages for those who persist. Every statistic points toward the same conclusion—ecommerce businesses that prioritize SEO build more valuable, more sustainable operations.
At White Label SEO Service, we help ecommerce businesses build the organic visibility that drives long-term growth. From technical audits to content strategy to authority building, our team delivers the comprehensive SEO programs these statistics prove effective. Contact us to discuss how we can accelerate your ecommerce SEO results.
Frequently Asked Questions About Ecommerce SEO Statistics
What percentage of ecommerce traffic comes from organic search?
Organic search typically drives 30% to 50% of total ecommerce website traffic for optimized stores. Newer sites may see 10% to 20%, while established sites with strong SEO often exceed 40%. The percentage depends on optimization level, domain authority, and competitive landscape.
How much should ecommerce businesses invest in SEO?
Small ecommerce businesses typically invest $500 to $2,000 monthly, mid-market companies spend $2,000 to $10,000 monthly, and enterprise operations allocate $10,000 to $50,000+ monthly. As a percentage, successful companies invest 5% to 15% of marketing budget in SEO.
What is the average conversion rate for organic ecommerce traffic?
Organic search traffic converts at approximately 2.8% on average for ecommerce, compared to 1.3% for social media and 1.8% for display advertising. Top-performing sites achieve 3% to 5% organic conversion rates through optimized landing pages and strong user experience.
How long until SEO generates revenue for ecommerce sites?
Initial ranking movement typically appears within 3 to 6 months, with meaningful traffic increases requiring 6 to 12 months. Revenue impact usually becomes significant around the 9 to 12 month mark, with returns accelerating in years two and three as authority compounds.
What is the ROI of ecommerce SEO compared to paid advertising?
SEO delivers customers at 60% to 70% lower cost than paid advertising over a 24-month period. Mature SEO programs show ROI between 275% and 1,220% depending on execution quality. The compounding nature of SEO creates exponential returns over time that paid advertising cannot match.
How important is mobile optimization for ecommerce SEO?
Mobile optimization is critical—60% of ecommerce sales now occur on mobile devices. Google’s mobile-first indexing means your mobile site determines rankings. Sites failing Core Web Vitals on mobile face ranking disadvantages and experience bounce rates 15% to 20% higher than optimized competitors.
Do backlinks still matter for ecommerce SEO rankings?
Yes, backlinks remain a primary ranking factor. The #1 result in Google has 3.8x more backlinks than positions 2-10 on average. For ecommerce, building links to category pages and blog content passes authority to commercial pages through internal linking, improving overall site rankings.


