
INP optimization directly impacts your search rankings, user experience, and conversion rates. Since Google replaced FID with INP as the official Core Web Vitals interactivity metric in March 2024, sites that previously passed interactivity thresholds now face new challenges meeting stricter measurement standards.
This shift matters because INP measures every interaction throughout a user’s session, not just the first click. Poor INP scores signal to Google that your site delivers a frustrating experience, potentially costing you visibility in competitive search results.
This guide covers everything from understanding the technical differences between FID and INP to implementing framework-specific optimization strategies. You’ll learn how to diagnose issues, prioritize fixes, and build a sustainable performance optimization workflow.
What Are FID and INP? Understanding Core Web Vitals Interactivity Metrics
Core Web Vitals measure three critical aspects of user experience: loading performance (LCP), visual stability (CLS), and interactivity. The interactivity metric has evolved significantly, moving from First Input Delay to Interaction to Next Paint as Google refined how it measures responsiveness.
Understanding both metrics helps you diagnose legacy issues and optimize for current standards. Many sites built their performance strategies around FID, only to discover their INP scores tell a different story.
First Input Delay (FID) Explained
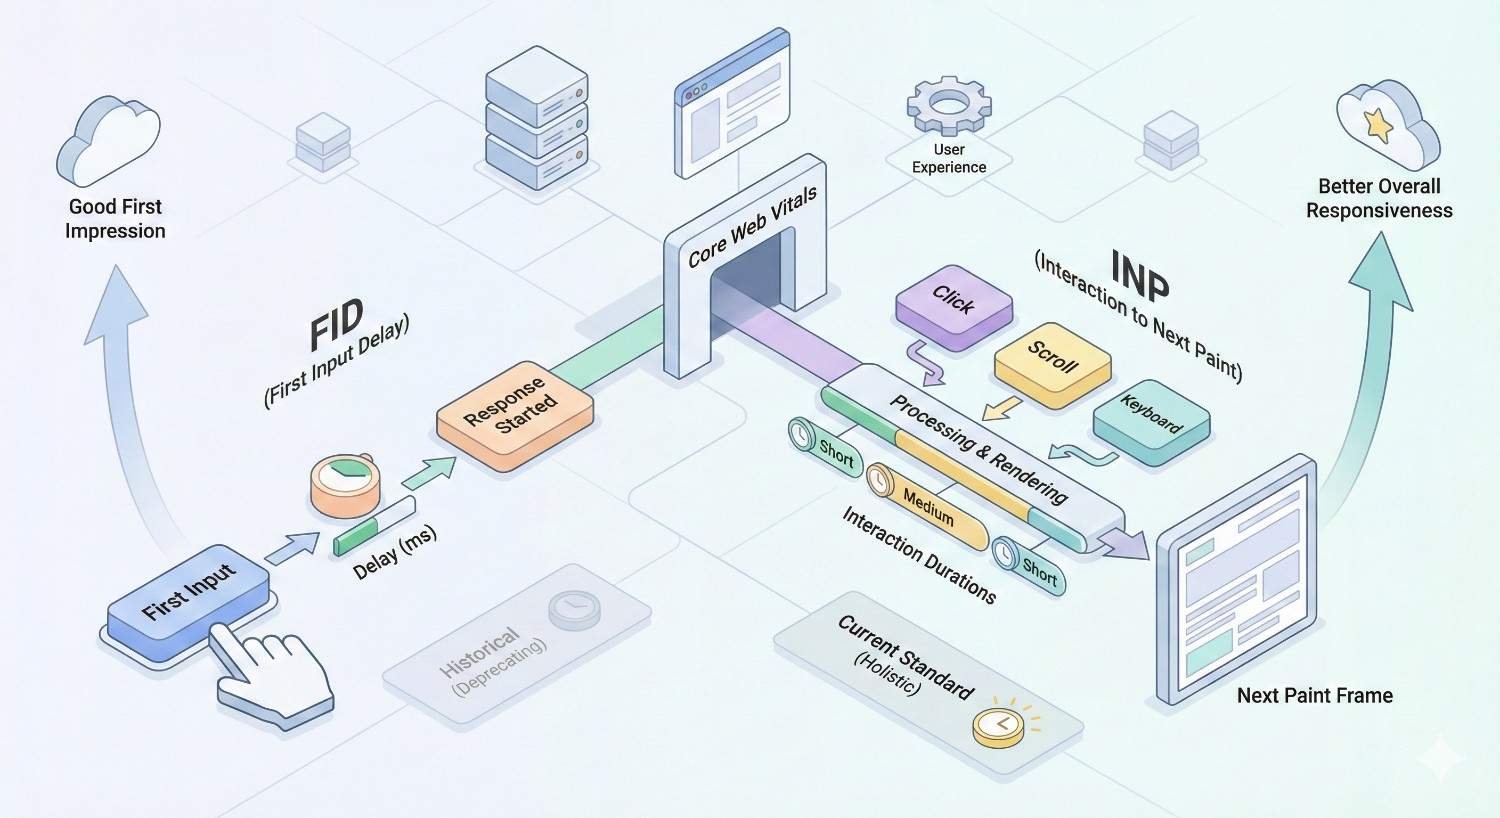
First Input Delay measured the time between a user’s first interaction with your page and when the browser could begin processing that interaction. It captured only the input delay portion of the first discrete interaction, such as clicking a button, tapping a link, or pressing a key.
FID focused exclusively on the delay caused by the main thread being busy with other tasks. If JavaScript was executing when a user clicked something, FID measured how long they waited before the browser could respond. It did not measure the actual processing time or the time until visual feedback appeared.
The metric had clear thresholds: under 100 milliseconds was considered good, 100-300ms needed improvement, and anything over 300ms was poor. Most websites passed FID because it only captured the first interaction, often occurring before heavy JavaScript fully loaded.
Interaction to Next Paint (INP) Explained
Interaction to Next Paint represents a fundamental shift in how Google measures interactivity. INP observes the latency of all click, tap, and keyboard interactions throughout the entire page lifecycle, then reports a single value representing the worst interaction experience (with some statistical adjustments for outliers on pages with many interactions).
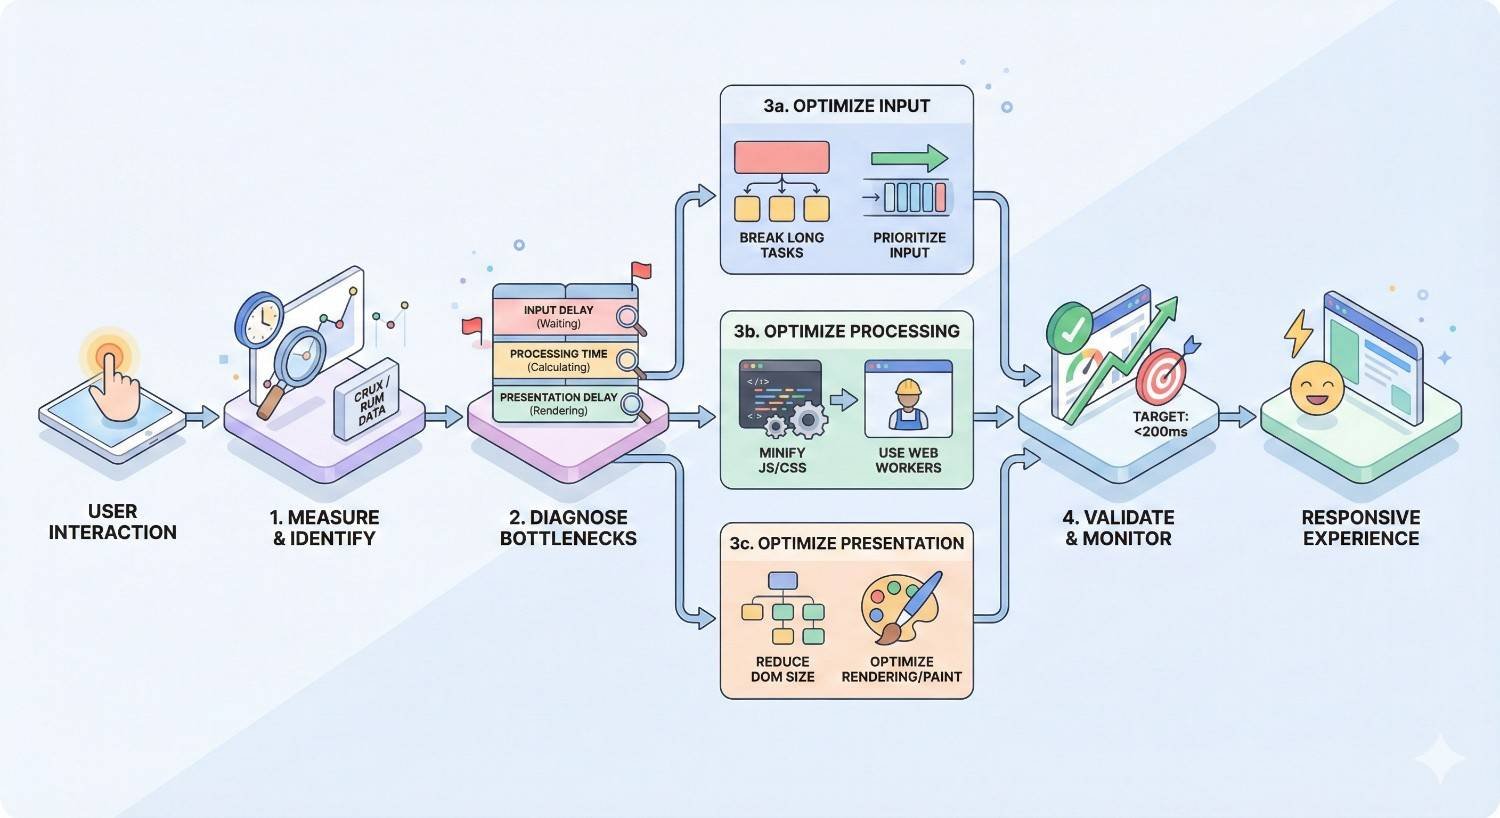
INP measures three phases of each interaction: input delay (time waiting for event handlers to start), processing time (time executing event handlers), and presentation delay (time until the browser renders the next frame). This comprehensive measurement captures the full user experience, not just initial responsiveness.
The thresholds for INP are: under 200 milliseconds is good, 200-500ms needs improvement, and over 500ms is poor. According to Google’s Web Vitals documentation, the metric uses the 75th percentile of all interactions to determine your score, meaning 75% of your users must have good experiences to pass.
Why Google Replaced FID with INP in March 2024
Google officially replaced FID with INP on March 12, 2024, after an extensive testing period that began in May 2022. The change addressed fundamental limitations in how FID measured real-world interactivity.
FID only captured the first interaction, which often occurred during initial page load before the heaviest JavaScript executed. Users frequently experienced their worst interactions later in their session, when clicking through menus, submitting forms, or interacting with dynamic content. FID missed these critical moments entirely.
INP also measures the complete interaction cycle. FID ignored processing time and presentation delay, meaning a site could pass FID while still delivering sluggish, frustrating interactions. A button click might register instantly (good FID) but take 800ms to show any visual response (terrible actual experience).
The transition revealed widespread performance issues. Chrome User Experience Report data showed that many sites passing FID failed INP thresholds, forcing a industry-wide reassessment of JavaScript performance strategies.
Why FID and INP Matter for SEO and User Experience
Interactivity metrics connect directly to both search visibility and business outcomes. Google uses Core Web Vitals as ranking signals, while users make split-second decisions about whether to stay on your site based on how responsive it feels.
Impact on Core Web Vitals and Page Experience Signals
Core Web Vitals form part of Google’s page experience signals, which influence how your pages perform in search results. INP joins LCP (Largest Contentful Paint) and CLS (Cumulative Layout Shift) as the three metrics Google evaluates for every indexed page.
Page experience signals work as a tiebreaker in competitive rankings. When multiple pages offer similar content quality and relevance, Google favors pages that deliver better user experiences. Failing INP thresholds puts you at a disadvantage against competitors who have optimized their interactivity.
Google Search Console reports Core Web Vitals status for your entire site, categorizing URLs as good, needs improvement, or poor. Pages failing INP may see reduced visibility in search results, particularly on mobile where interactivity issues are more pronounced.
How Interactivity Metrics Affect Search Rankings
Google confirmed Core Web Vitals as ranking factors in 2021, and the transition to INP maintained this relationship. While content relevance and authority remain primary ranking factors, page experience provides meaningful differentiation in competitive niches.
The ranking impact varies by query type and competition level. For highly competitive commercial queries where multiple authoritative sites compete, Core Web Vitals can determine which pages appear in top positions. For less competitive informational queries, the impact may be smaller but still measurable.
Mobile rankings show stronger correlation with Core Web Vitals performance. Mobile users have less patience for slow interactions, and Google’s mobile-first indexing prioritizes the mobile experience when determining rankings.
The Business Case: Conversions, Bounce Rates, and Revenue
Poor interactivity directly impacts your bottom line. When users click buttons that don’t respond, tap links that seem broken, or wait for forms to process, they abandon your site. Every failed interaction represents potential lost revenue.
Research from Google and Deloitte found that improving mobile site speed by 0.1 seconds increased conversion rates by 8.4% for retail sites and 10.1% for travel sites. Interactivity improvements show similar patterns, as responsive interfaces build user confidence and reduce friction.
Bounce rates increase dramatically when interactions feel sluggish. Users interpret slow responses as technical problems, questioning whether their action registered. This uncertainty drives them to competing sites that feel more reliable and professional.
How to Measure FID and INP Performance
Accurate measurement forms the foundation of any optimization strategy. You need both lab data for debugging and field data for understanding real user experiences.
Lab Tools vs. Field Data: Understanding the Difference
Lab tools run controlled tests in simulated environments, providing consistent, reproducible results. They help identify specific performance issues and validate fixes before deployment. However, lab tools cannot capture the full range of real-world conditions your users experience.
Field data comes from actual users visiting your site across diverse devices, network conditions, and usage patterns. It reflects genuine performance but includes variability that makes debugging specific issues challenging. Field data determines your official Core Web Vitals status.
FID could only be measured in the field because it required real user interaction. INP can be approximated in lab environments using Total Blocking Time (TBT) as a proxy, though field data remains the authoritative source for your actual INP score.
Using Google PageSpeed Insights and Lighthouse
Google PageSpeed Insights combines lab and field data in a single report. The top section shows field data from the Chrome User Experience Report when available, while the bottom section displays Lighthouse lab results.
For INP specifically, PageSpeed Insights shows your field INP score when sufficient data exists. The lab section reports Total Blocking Time, which correlates with INP but measures something different. Use TBT as a directional indicator, not an exact INP prediction.
Lighthouse, available in Chrome DevTools and as a standalone tool, provides detailed performance audits. The Performance panel identifies long tasks, JavaScript execution time, and main thread blocking that contribute to poor INP. Run Lighthouse in incognito mode to avoid extension interference.
Chrome User Experience Report (CrUX) Data Analysis
The Chrome User Experience Report aggregates anonymized performance data from Chrome users who have opted into sharing usage statistics. CrUX provides the official field data Google uses for Core Web Vitals assessment.
Access CrUX data through multiple channels: PageSpeed Insights for individual URLs, Search Console for site-wide trends, the CrUX API for programmatic access, and BigQuery for detailed analysis. Each channel serves different use cases.
CrUX data updates monthly, with a 28-day rolling collection period. This means changes you implement today won’t appear in CrUX data for several weeks. Plan your optimization timeline accordingly, and don’t expect immediate feedback from field metrics.
Web Vitals JavaScript Library Implementation
The Web Vitals JavaScript library lets you collect Core Web Vitals data from your own users. This provides faster feedback than waiting for CrUX updates and allows segmentation by page type, user cohort, or other dimensions.
Implementation requires adding the library to your pages and sending collected metrics to your analytics platform. The library captures INP, LCP, CLS, FID (for historical comparison), TTFB, and FCP. Most analytics platforms now offer built-in Web Vitals integration.
javascript
Copy
import {onINP} from ‘web-vitals’;
onINP(console.log);
This basic implementation logs INP values to the console. Production implementations should send data to your analytics system for aggregation and analysis.
Interpreting INP Scores: Good, Needs Improvement, Poor
INP uses the 75th percentile of all interactions on a page to determine its score. This means if 100 users each have one interaction, the 75th worst interaction determines your INP value.
Good (Green): Under 200 milliseconds. Your page responds quickly to user interactions. Most users experience smooth, responsive interfaces.
Needs Improvement (Yellow): 200-500 milliseconds. Users notice delays but may tolerate them. Optimization should be prioritized to prevent further degradation.
Poor (Red): Over 500 milliseconds. Users experience frustrating delays that feel broken. Immediate optimization is critical for both user experience and SEO.
Focus on the worst interactions first. A page with 50 fast interactions and 5 slow ones will fail INP because those slow interactions push the 75th percentile above threshold.
Common Causes of Poor FID and INP Scores
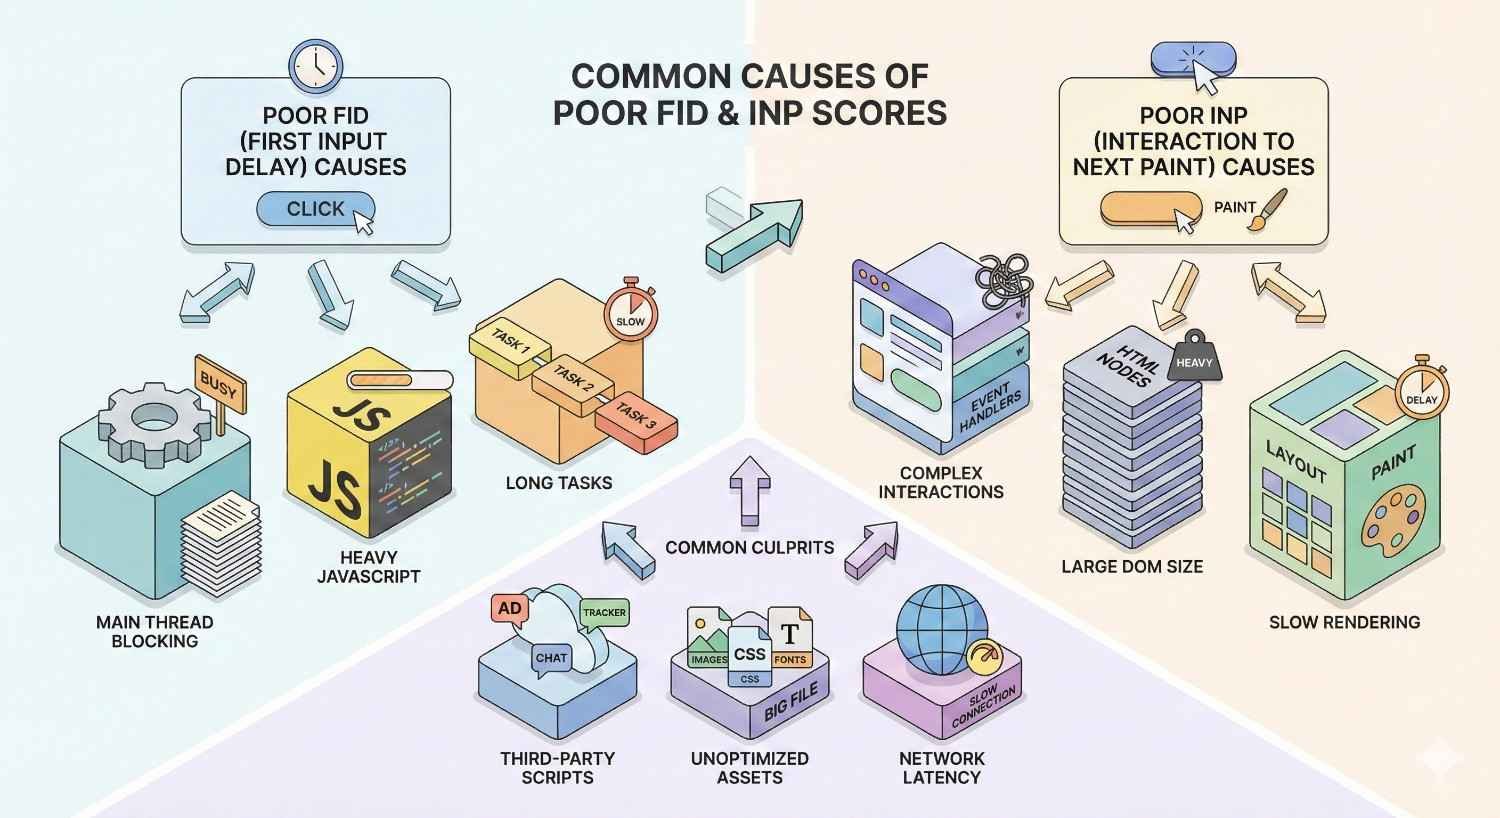
Understanding root causes helps you target optimization efforts effectively. Most INP issues trace back to JavaScript execution blocking the main thread during user interactions.
Heavy JavaScript Execution and Main Thread Blocking
The browser’s main thread handles JavaScript execution, style calculations, layout, painting, and user input processing. When JavaScript monopolizes the main thread, user interactions queue up waiting for execution time.
Long-running JavaScript functions block the main thread for their entire duration. A function taking 300ms to execute means any user interaction during that time waits at least 300ms before the browser can respond. This directly impacts INP.
Modern web applications often load megabytes of JavaScript, much of which executes during page load and user interactions. Each framework, library, and custom script competes for main thread time, creating cumulative blocking that degrades interactivity.
Third-Party Scripts and Tag Manager Bloat
Third-party scripts for analytics, advertising, chat widgets, social media, and marketing automation collectively consume significant main thread time. Each script adds execution overhead, and many run event handlers that compete with your own code.
Tag managers compound the problem by loading multiple scripts through a single container. While convenient for marketing teams, tag managers often load scripts synchronously and without performance budgets. A single poorly-optimized tag can tank your INP score.
Audit your third-party scripts regularly. Many sites accumulate scripts over time without removing deprecated tools. Each unnecessary script represents wasted main thread time that could be serving user interactions.
Large DOM Size and Complex Event Handlers
DOM size directly impacts interaction performance. Larger DOMs require more time for style recalculation, layout, and painting after each interaction. Event handlers that query or modify large DOM sections amplify this effect.
Complex event handlers that perform heavy computation, make synchronous network requests, or trigger extensive DOM modifications create long tasks that block subsequent interactions. A click handler that takes 400ms to execute guarantees poor INP for that interaction.
Event handler complexity often grows organically as features are added. What started as a simple click handler accumulates validation logic, analytics tracking, animation triggers, and state updates until it becomes a performance bottleneck.
Render-Blocking Resources and Long Tasks
Render-blocking CSS and synchronous JavaScript prevent the browser from rendering content until they fully load and execute. While primarily affecting initial load performance, render-blocking resources also impact interactions that trigger new resource loads.
Long tasks are JavaScript executions exceeding 50 milliseconds. The browser cannot respond to user input during long tasks, creating the delays INP measures. Chrome DevTools flags long tasks in the Performance panel, making them easy to identify.
Multiple shorter tasks can be as problematic as single long tasks if they execute consecutively without yielding to the main thread. The browser needs gaps between tasks to process pending user interactions.
Hydration Issues in JavaScript Frameworks
Server-side rendered applications using React, Vue, Next.js, or Nuxt must “hydrate” on the client, attaching JavaScript event handlers to server-rendered HTML. During hydration, the page appears interactive but doesn’t respond to user input.
Hydration typically involves executing significant JavaScript to reconcile server-rendered DOM with client-side component state. Users who interact during this period experience delays or completely ignored interactions, severely impacting INP.
The hydration problem worsens with application complexity. Larger component trees require more hydration time, and deeply nested components may hydrate in unpredictable orders, creating inconsistent interaction experiences.
FID and INP Optimization Strategies
Effective optimization requires systematic approaches to JavaScript execution, task scheduling, third-party management, and event handling. The following strategies address the most common INP issues.
Reducing JavaScript Execution Time
Less JavaScript means less main thread blocking. Every kilobyte of JavaScript you remove or defer improves your capacity to handle user interactions responsively.
Code Splitting and Lazy Loading
Code splitting divides your JavaScript bundle into smaller chunks loaded on demand. Instead of loading your entire application upfront, you load only the code needed for the current view, deferring the rest until required.
Route-based splitting loads JavaScript for each page separately. Component-based splitting defers heavy components like charts, editors, or complex forms until users interact with them. Both approaches reduce initial JavaScript execution and spread the load across the user session.
Lazy loading extends this concept to any resource. Images, videos, and below-the-fold content can load as users scroll, reducing initial page weight and freeing main thread time for interactions.
Tree Shaking and Dead Code Elimination
Tree shaking removes unused code from your JavaScript bundles during the build process. Modern bundlers like Webpack, Rollup, and esbuild analyze your import statements and exclude functions, classes, and modules you never actually use.
Effective tree shaking requires ES6 module syntax (import/export) rather than CommonJS (require). Many libraries ship both formats; ensure your bundler configuration selects the ES6 version for optimal tree shaking.
Audit your dependencies for tree-shaking compatibility. Some libraries bundle all functionality regardless of what you import. Consider alternatives that support selective imports or provide modular packages.
Minification and Compression Best Practices
Minification removes whitespace, shortens variable names, and applies other transformations that reduce JavaScript file size without changing functionality. Smaller files download faster and parse more quickly.
Compression (gzip or Brotli) further reduces transfer size. Brotli typically achieves 15-20% better compression than gzip for JavaScript files. Ensure your server or CDN serves compressed assets with appropriate Content-Encoding headers.
Source maps should be generated for debugging but not served to production users. Configure your build process to create source maps for error tracking services while excluding them from public asset delivery.
Breaking Up Long Tasks
Long tasks block the main thread, preventing interaction responses. Breaking them into smaller chunks allows the browser to process user input between task segments.
Using requestIdleCallback and setTimeout
requestIdleCallback schedules work during browser idle periods when no user interactions or critical rendering tasks are pending. It’s ideal for non-urgent work like analytics, prefetching, or background processing.
javascript
Copy
requestIdleCallback(() => {
// Non-critical work here
}, { timeout: 2000 });
setTimeout with a zero or small delay yields to the main thread, allowing pending interactions to process before continuing. This simple technique can dramatically improve INP for long-running operations.
javascript
Copy
function processInChunks(items, processItem) {
let index = 0;
function processNext() {
const start = performance.now();
while (index < items.length && performance.now() – start < 50) {
processItem(items[index++]);
}
if (index < items.length) {
setTimeout(processNext, 0);
}
}
processNext();
}
Yielding to the Main Thread
Yielding means voluntarily pausing JavaScript execution to let the browser handle other tasks. Strategic yields during long operations ensure user interactions receive timely responses.
The scheduler.yield() API (where supported) provides explicit yielding with proper task prioritization. For broader compatibility, setTimeout(fn, 0) or wrapping work in Promises achieves similar results.
Identify natural breakpoints in your code where yielding makes sense. Loop iterations, sequential operations, and state transitions often provide good yielding opportunities without complicating your logic.
Scheduler API Implementation
The Scheduler API provides fine-grained control over task prioritization. You can schedule tasks with different priority levels, ensuring critical user-facing work executes before background processing.
javascript
Copy
scheduler.postTask(() => {
// High-priority user-visible work
}, { priority: ‘user-blocking’ });
scheduler.postTask(() => {
// Background work
}, { priority: ‘background’ });
Priority levels include user-blocking (highest), user-visible (default), and background (lowest). The browser schedules tasks accordingly, helping maintain responsiveness during heavy processing.
Optimizing Third-Party Scripts
Third-party scripts often contribute disproportionately to INP issues. Systematic management reduces their impact while preserving necessary functionality.
Auditing and Removing Unnecessary Scripts
Inventory every third-party script on your site, documenting its purpose, owner, and business justification. Many sites discover scripts for discontinued campaigns, deprecated tools, or redundant functionality.
Measure each script’s performance impact using Chrome DevTools or WebPageTest. Identify scripts that execute long tasks, add significant JavaScript weight, or run expensive event handlers. Prioritize removal or replacement of the worst offenders.
Establish a governance process for adding new scripts. Require performance impact assessment and business justification before deployment. Set performance budgets that limit total third-party JavaScript.
Async and Defer Loading Strategies
The async attribute loads scripts in parallel with HTML parsing and executes them immediately upon download. Use async for scripts that don’t depend on DOM content or other scripts.
The defer attribute loads scripts in parallel but delays execution until HTML parsing completes. Deferred scripts execute in order, making defer suitable for scripts with dependencies.
html
Copy
<script src=”analytics.js“ async></script>
<script src=”app.js“ defer></script>
Neither async nor defer helps scripts already loaded through tag managers. Configure your tag manager to load scripts with appropriate timing, or move critical scripts outside the tag manager for better control.
Self-Hosting Critical Third-Party Resources
Self-hosting eliminates DNS lookups, connection establishment, and potential third-party server delays. For critical resources like fonts or essential libraries, self-hosting often improves performance.
Download the resource, host it on your domain or CDN, and update references. Implement a process to check for updates, as self-hosted resources don’t automatically receive patches or improvements.
Self-hosting isn’t appropriate for all third-party resources. Scripts that require real-time updates, A/B testing, or server-side processing must remain externally hosted. Evaluate each resource individually.
Improving Event Handler Efficiency
Event handlers execute in response to user interactions, directly impacting INP. Efficient handlers respond quickly, keeping interactions feeling snappy.
Debouncing and Throttling Techniques
Debouncing delays function execution until a pause in events. For search inputs, debouncing waits until the user stops typing before executing the search, preventing unnecessary processing during rapid input.
javascript
Copy
function debounce(fn, delay) {
let timeout;
return (…args) => {
clearTimeout(timeout);
timeout = setTimeout(() => fn(…args), delay);
};
}
Throttling limits function execution to a maximum frequency. For scroll or resize handlers, throttling ensures the function runs at most once per interval, preventing performance degradation during continuous events.
javascript
Copy
function throttle(fn, interval) {
let lastTime = 0;
return (…args) => {
const now = Date.now();
if (now – lastTime >= interval) {
lastTime = now;
fn(…args);
}
};
}
Event Delegation Patterns
Event delegation attaches a single event listener to a parent element rather than individual listeners to each child. The parent listener uses event bubbling to handle events from any descendant.
javascript
Copy
document.querySelector(‘.list’).addEventListener(‘click’, (e) => {
if (e.target.matches(‘.list-item’)) {
handleItemClick(e.target);
}
});
Delegation reduces memory usage and improves performance for dynamic content. Instead of attaching and removing listeners as elements are added or removed, the single parent listener handles everything.
This pattern particularly benefits lists, tables, and other repeating structures. A list with 1,000 items needs only one listener instead of 1,000, dramatically reducing event handling overhead.
Passive Event Listeners
Passive event listeners tell the browser that the handler won’t call preventDefault(), allowing the browser to perform default actions (like scrolling) without waiting for JavaScript execution.
javascript
Copy
element.addEventListener(‘touchstart’, handler, { passive: true });
Scroll and touch event handlers should almost always be passive. Non-passive handlers block scrolling until JavaScript executes, creating the janky scroll experience users hate.
Modern browsers treat touch and wheel event listeners as passive by default, but explicitly declaring passive intent ensures consistent behavior and documents your performance intentions.
Framework-Specific Optimization Techniques
Each JavaScript framework presents unique INP challenges and optimization opportunities. Understanding framework-specific patterns helps you apply targeted fixes.
React INP Optimization
React’s reconciliation process can create long tasks when updating large component trees. Use React.memo, useMemo, and useCallback to prevent unnecessary re-renders that block the main thread.
Concurrent features in React 18+ help manage rendering priority. useTransition marks state updates as non-urgent, allowing React to interrupt rendering to handle user interactions. useDeferredValue delays updating expensive computations.
javascript
Copy
const [isPending, startTransition] = useTransition();
function handleClick() {
startTransition(() => {
setExpensiveState(newValue);
});
}
Virtualization libraries like react-window or react-virtualized render only visible list items, dramatically reducing DOM size and rendering overhead for long lists.
Next.js and Server Components
Next.js 13+ Server Components reduce client-side JavaScript by rendering components entirely on the server. Only interactive components need client-side JavaScript, shrinking bundles and improving INP.
Use the ‘use client’ directive sparingly, marking only components that require browser APIs or interactivity. Keep Server Components as the default, pushing interactivity to leaf components.
Next.js automatic code splitting loads JavaScript per-route. Combine this with dynamic imports for heavy components to minimize JavaScript execution during initial load and interactions.
javascript
Copy
const HeavyComponent = dynamic(() => import(‘./HeavyComponent’), {
loading: () => <Skeleton />,
});
Vue and Nuxt Performance Tuning
Vue’s reactivity system can trigger excessive re-renders if not managed carefully. Use v-once for static content, v-memo for conditional memoization, and computed properties instead of methods for derived values.
Nuxt 3’s hybrid rendering modes let you choose server-side rendering, static generation, or client-side rendering per route. Server-render content-heavy pages while client-rendering highly interactive sections.
Component lazy loading in Vue uses dynamic imports with defineAsyncComponent. Combine with Suspense for loading states that maintain visual stability during component loading.
javascript
Copy
const AsyncComponent = defineAsyncComponent(() =>
import(‘./HeavyComponent.vue’)
);
WordPress and PHP-Based CMS Solutions
WordPress sites often suffer from plugin bloat, with each plugin adding JavaScript that competes for main thread time. Audit active plugins, removing or replacing those with poor performance characteristics.
Use asset optimization plugins like WP Rocket, Autoptimize, or Perfmatters to defer non-critical JavaScript, combine files, and implement lazy loading. Configure these tools to exclude critical interactive elements from deferral.
Consider headless WordPress architectures for highly interactive sites. Decoupling the frontend from WordPress allows modern JavaScript frameworks to handle interactivity while WordPress manages content.
Step-by-Step INP Optimization Workflow
Systematic optimization produces better results than random fixes. Follow this workflow to identify, prioritize, and resolve INP issues efficiently.
Step 1: Diagnose with Field Data and Lab Tools
Start with field data to understand your actual INP performance. Check Google Search Console’s Core Web Vitals report for site-wide status, then use PageSpeed Insights for page-level details.
Identify your worst-performing pages and page templates. A single problematic template (like product pages or blog posts) can affect thousands of URLs. Prioritize templates over individual pages for maximum impact.
Run Lighthouse audits on representative pages from each template. Note Total Blocking Time, JavaScript execution time, and flagged long tasks. These lab metrics guide your debugging even though they don’t directly measure INP.
Step 2: Identify Slow Interactions Using DevTools
Chrome DevTools Performance panel records detailed interaction traces. Enable “Web Vitals” in the settings, then record while interacting with your page. The timeline shows exactly what happens during each interaction.
Look for long tasks (marked with red corners) occurring during or immediately after interactions. Expand these tasks to see which functions consume the most time. The call stack reveals whether the issue is your code, framework code, or third-party scripts.
The Performance Insights panel provides a more guided experience, automatically highlighting INP issues and suggesting optimizations. Use this for quick diagnosis before diving into detailed traces.
Step 3: Prioritize Fixes by Impact and Effort
Not all optimizations deliver equal value. Prioritize fixes that affect the most users, the most important pages, or the most critical interactions.
Create a matrix plotting potential impact against implementation effort. Quick wins (high impact, low effort) should be implemented immediately. Strategic investments (high impact, high effort) require planning. Avoid low-impact work regardless of effort level.
Consider business context when prioritizing. A slow checkout button impacts revenue directly, while a slow footer link matters less. Focus optimization efforts where they drive business outcomes.
Step 4: Implement Optimizations Incrementally
Make one change at a time when possible. Bundling multiple changes makes it impossible to attribute improvements or regressions to specific optimizations.
Test changes in staging environments before production deployment. Use lab tools to verify improvements, but remember that lab results don’t guarantee field improvements. Real user conditions vary significantly.
Document each optimization, including the problem identified, solution implemented, and measured impact. This documentation helps future optimization efforts and prevents regression.
Step 5: Monitor and Validate Improvements
Field data takes time to reflect changes. CrUX data updates monthly with a 28-day collection window, meaning improvements may take 4-6 weeks to appear in official metrics.
Implement real-user monitoring (RUM) for faster feedback. The Web Vitals library or commercial RUM tools provide daily or even real-time INP data, letting you validate improvements without waiting for CrUX updates.
Set up alerts for INP regressions. New deployments, third-party script updates, or traffic pattern changes can degrade performance. Automated monitoring catches issues before they impact rankings.
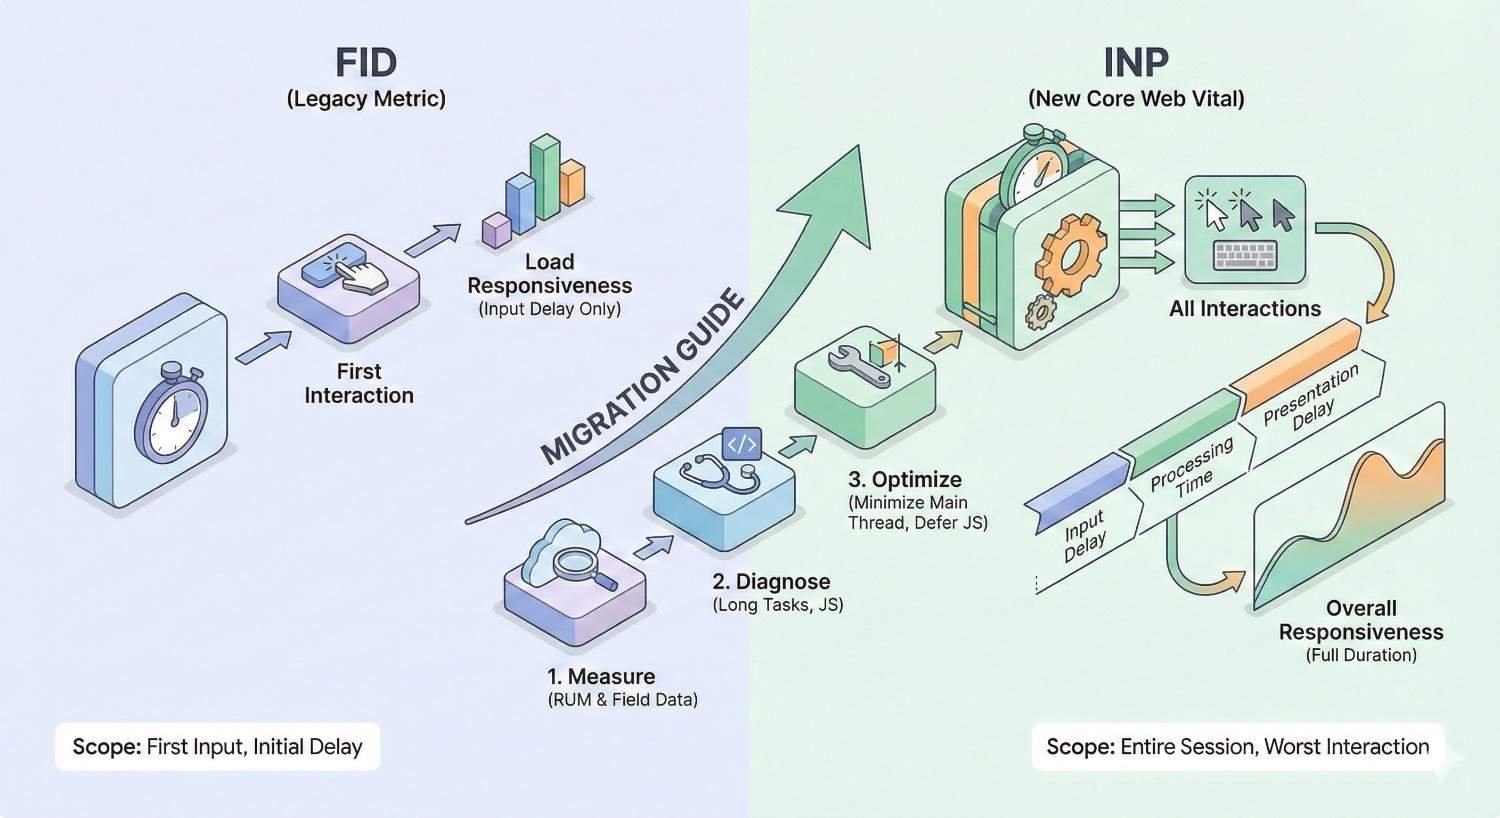
FID vs. INP: Key Differences and Migration Guide
Understanding the technical differences between FID and INP helps you adapt existing optimization strategies and explains why previously passing sites may now fail.
Technical Differences Between FID and INP
FID measured only input delay for the first interaction. INP measures input delay, processing time, and presentation delay for all interactions, reporting the worst experience.
FID captured a single moment; INP captures the entire session. A page with one fast first interaction and many slow subsequent interactions would pass FID but fail INP.
FID thresholds were tighter (100ms good) because it measured less. INP thresholds are looser (200ms good) because it measures more, but the comprehensive measurement makes passing harder overall.
Why Sites Passing FID May Fail INP
First interactions often occur during initial page load, before heavy JavaScript fully executes. Users clicking navigation links or hero CTAs interact with relatively responsive pages.
Later interactions happen after JavaScript frameworks hydrate, third-party scripts load, and complex event handlers attach. These interactions face more competition for main thread time, resulting in longer delays.
FID also ignored processing time. A click handler that responded instantly (good FID) but took 500ms to execute (bad INP) would pass FID while failing INP. Many sites optimized for input delay without addressing processing efficiency.
Transitioning Your Optimization Strategy Post-March 2024
Audit all interactions, not just first clicks. Use the Performance panel to test menu interactions, form submissions, infinite scroll, and other common user actions throughout the page lifecycle.
Shift focus from input delay to total interaction latency. Optimizing event handler efficiency matters as much as reducing main thread blocking during initial load.
Update your monitoring to track INP specifically. Legacy FID monitoring provides historical context but doesn’t reflect current Core Web Vitals status. Ensure your RUM solution captures INP data.
How Long Does INP Optimization Take to Impact Rankings?
Performance improvements don’t instantly translate to ranking changes. Understanding the timeline helps set realistic expectations and maintain stakeholder confidence during optimization projects.
Realistic Timelines for Core Web Vitals Improvements
Technical implementation varies from days to months depending on issue complexity. Simple fixes like adding async attributes might deploy in hours. Architectural changes like implementing code splitting require weeks of development and testing.
Field data collection requires 28 days minimum. CrUX aggregates data over a rolling 28-day window, so even instant improvements take nearly a month to fully reflect in official metrics.
Total timeline from implementation to CrUX update typically spans 4-8 weeks. Plan optimization projects with this timeline in mind, and use RUM data for interim validation.
When Google Recrawls and Updates CrUX Data
CrUX data updates monthly, typically in the first week of each month. The update reflects data collected during the previous 28-day period, not real-time performance.
Google Search Console updates Core Web Vitals reports shortly after CrUX updates. The “Page Experience” report shows your current status, while the “Core Web Vitals” report provides historical trends.
Googlebot recrawls pages on its own schedule, independent of CrUX updates. However, Core Web Vitals assessment uses CrUX field data, not Googlebot’s lab measurements. Recrawl frequency doesn’t directly affect when performance improvements impact rankings.
Setting Expectations for SEO Performance Gains
Core Web Vitals function as a tiebreaker, not a primary ranking factor. Improving INP won’t overcome content quality or authority deficits, but it can provide an edge against equally matched competitors.
Ranking improvements from Core Web Vitals optimization are typically modest and gradual. Expect incremental gains over months rather than dramatic jumps. The primary benefit is often maintaining positions rather than gaining new ones.
User experience improvements deliver more immediate business impact than ranking changes. Faster interactions increase conversions, reduce bounce rates, and improve engagement metrics that indirectly support SEO through better user signals.
DIY vs. Professional FID and INP Optimization
Deciding whether to handle optimization in-house or engage specialists depends on your technical capabilities, resource availability, and the complexity of your performance issues.
When to Handle Optimization In-House
Teams with JavaScript expertise and performance profiling experience can often address common INP issues independently. If your developers understand the browser event loop, can interpret DevTools traces, and have authority to modify frontend code, DIY optimization is viable.
Simple issues like missing async/defer attributes, obvious third-party script bloat, or basic code splitting opportunities don’t require specialist intervention. Documentation from Google and framework maintainers provides sufficient guidance.
In-house optimization works best when you have dedicated time for performance work. Optimization competes with feature development; without protected time, performance improvements perpetually defer to business priorities.
Signs You Need Technical SEO Expertise
Complex architectural issues often require specialist knowledge. If your INP problems stem from framework hydration, build configuration, or deep JavaScript optimization, specialists bring experience from similar projects.
Persistent issues despite optimization attempts suggest underlying problems your team hasn’t identified. Fresh perspectives from performance specialists often reveal issues internal teams overlook due to familiarity with the codebase.
Time constraints may justify external help even for addressable issues. Specialists complete optimization projects faster than teams learning performance optimization while maintaining other responsibilities.
What to Expect from a Core Web Vitals Audit
Professional audits begin with comprehensive measurement across your site, identifying patterns and prioritizing issues by impact. Expect detailed reports documenting current performance, root causes, and specific recommendations.
Quality audits provide actionable recommendations, not just problem identification. Each recommendation should include implementation guidance, expected impact, and effort estimation. Vague suggestions like “reduce JavaScript” aren’t helpful.
Ongoing support distinguishes thorough engagements from superficial audits. Performance optimization is iterative; initial fixes reveal new issues, and continuous monitoring catches regressions. Ensure your engagement includes follow-up support.
FID and INP Optimization Tools and Resources
The right tools accelerate diagnosis and validation. Combine free Google tools with specialized platforms for comprehensive performance management.
Free Tools for Measuring and Monitoring
Google PageSpeed Insights provides instant Core Web Vitals assessment for any URL, combining field data (when available) with lab analysis. Use it for quick checks and competitive benchmarking.
Google Search Console offers site-wide Core Web Vitals reporting, showing which URLs pass, need improvement, or fail. The report groups URLs by similar performance, helping identify template-level issues.
Chrome DevTools provides the deepest diagnostic capabilities. The Performance panel records detailed traces, while Lighthouse runs comprehensive audits. Both are essential for identifying specific optimization opportunities.
WebPageTest offers advanced testing with multiple locations, devices, and connection speeds. Its filmstrip view and waterfall charts reveal loading behavior that other tools miss.
Premium Performance Monitoring Platforms
Calibre, SpeedCurve, and DebugBear provide continuous monitoring with historical trends, alerting, and competitive benchmarking. These platforms catch regressions quickly and demonstrate improvement over time.
Real User Monitoring (RUM) platforms like New Relic, Datadog, or Raygun collect performance data from actual users, providing faster feedback than CrUX and enabling segmentation by geography, device, or user cohort.
Premium tools justify their cost through time savings and proactive issue detection. For sites where performance directly impacts revenue, monitoring investments typically deliver positive ROI.
Developer Documentation and Learning Resources
web.dev hosts Google’s official performance documentation, including detailed INP optimization guides, case studies, and best practices. Start here for authoritative guidance.
Chrome Developers provides technical documentation on DevTools, CrUX, and browser APIs relevant to performance optimization. The site includes tutorials and reference materials for developers.
Framework-specific documentation addresses optimization within React, Vue, Next.js, and other platforms. Each framework’s performance guide covers patterns and tools specific to that ecosystem.
Conclusion: Building a Sustainable Interactivity Optimization Strategy
INP optimization requires ongoing attention, not one-time fixes. The strategies covered in this guide provide a foundation for achieving and maintaining good Core Web Vitals scores while delivering the responsive experiences users expect.
Key Takeaways for Business Owners and Marketers
INP directly impacts both search rankings and conversion rates. Sites failing INP thresholds face competitive disadvantages in search results and lose customers to frustrating interaction delays. The business case for optimization is clear.
Optimization requires technical implementation but delivers business outcomes. Work with your development team or technical partners to prioritize INP improvements alongside feature development. Performance is a feature that affects every user interaction.
Expect gradual improvements over weeks to months. CrUX data collection, Google’s ranking updates, and cumulative optimization efforts all take time. Maintain consistent focus rather than expecting overnight transformations.
Next Steps: Auditing Your Site’s Interactivity Performance
Start by checking your current INP status in Google Search Console and PageSpeed Insights. Identify whether you’re passing, need improvement, or failing, and which pages or templates contribute to poor scores.
Run Chrome DevTools Performance recordings on your worst-performing pages. Identify the specific interactions and code paths causing delays. This diagnostic work guides your optimization priorities.
Implement the highest-impact optimizations first, validate improvements with RUM data, and iterate. Performance optimization is a continuous process, not a project with a defined end. Build monitoring and optimization into your ongoing site maintenance.
We help businesses worldwide build sustainable organic growth through technical SEO excellence. White Label SEO Service provides comprehensive Core Web Vitals audits, implementation support, and ongoing performance monitoring to ensure your site delivers the fast, responsive experiences that users and search engines demand.
Frequently Asked Questions About FID and INP Optimization
What is a good INP score?
A good INP score is under 200 milliseconds, meaning 75% of your users experience interaction delays below this threshold. Scores between 200-500ms need improvement, while scores over 500ms are considered poor and require immediate attention.
Does INP affect mobile and desktop rankings differently?
Google evaluates Core Web Vitals separately for mobile and desktop, and mobile-first indexing means mobile performance typically matters more for rankings. Mobile devices often have slower processors and network connections, making INP optimization particularly important for mobile users.
Can INP optimization improve conversion rates?
Yes, faster interactions directly correlate with higher conversion rates. Users who experience responsive interfaces complete more purchases, form submissions, and other conversion actions. Reducing interaction delays removes friction from your conversion funnel.
How often should I monitor Core Web Vitals?
Monitor Core Web Vitals continuously using Real User Monitoring tools for immediate feedback, and review CrUX data monthly when it updates. Set up automated alerts for regressions so you can address issues before they impact rankings or user experience.
What’s the relationship between INP, LCP, and CLS?
INP, LCP, and CLS are the three Core Web Vitals metrics that together measure page experience. LCP measures loading performance, CLS measures visual stability, and INP measures interactivity. All three must pass their respective thresholds for a page to have “good” Core Web Vitals status.
Why did my site pass FID but fail INP?
FID only measured the first interaction’s input delay, while INP measures all interactions throughout the session including processing and presentation time. Sites often have fast first interactions but slow subsequent interactions, or fast input delay but slow event handler execution.
How long until INP improvements show in Google Search Console?
INP improvements typically take 4-8 weeks to appear in Search Console. CrUX data requires a 28-day collection period, and Search Console updates shortly after monthly CrUX releases. Use Real User Monitoring for faster validation of your optimization efforts.


