
Server response time directly impacts your search rankings, user experience, and bottom line. When your server takes too long to respond, visitors leave, Google notices, and your revenue suffers. The difference between a 200ms and 800ms response can mean thousands in lost conversions.
This technical SEO factor often gets overlooked while businesses chase content and backlinks. Yet fixing slow server response delivers immediate, measurable improvements to Core Web Vitals and crawl efficiency.
This guide covers everything from measuring your current performance to implementing proven optimization strategies across WordPress, Shopify, and custom platforms.
What Is Server Response Time?
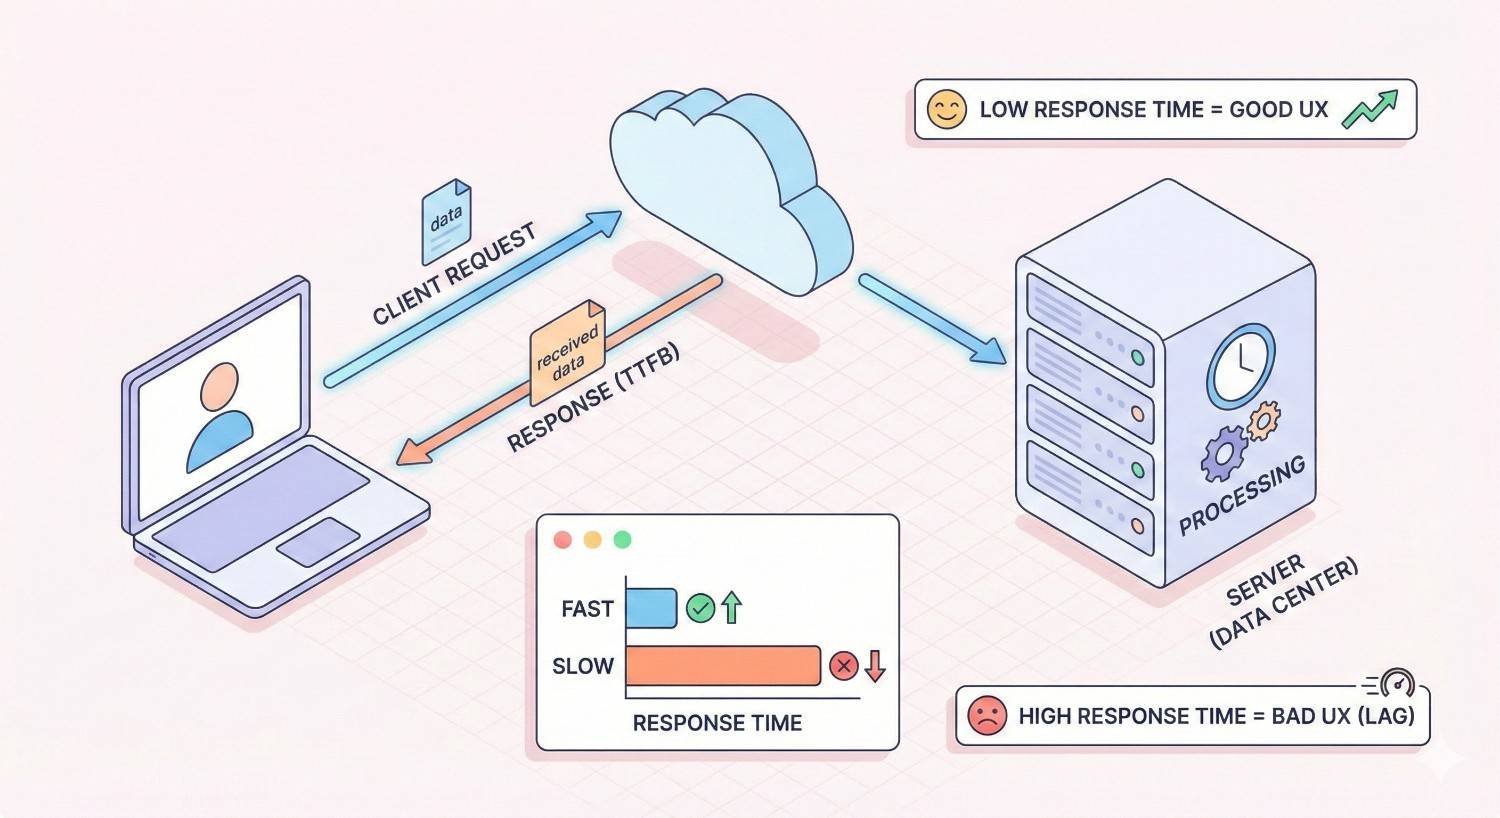
Server response time measures how long your web server takes to respond to a browser’s request. When someone clicks a link to your website, their browser sends a request to your server. The server processes that request, retrieves the necessary data, and sends back the first byte of information.
This entire process happens before any visible content appears on screen. A slow server response creates a bottleneck that delays everything else, including rendering, images, and interactive elements.
Think of it as the starting gun in a race. If the gun fires late, every runner crosses the finish line late, regardless of how fast they run.
Time to First Byte (TTFB) Explained
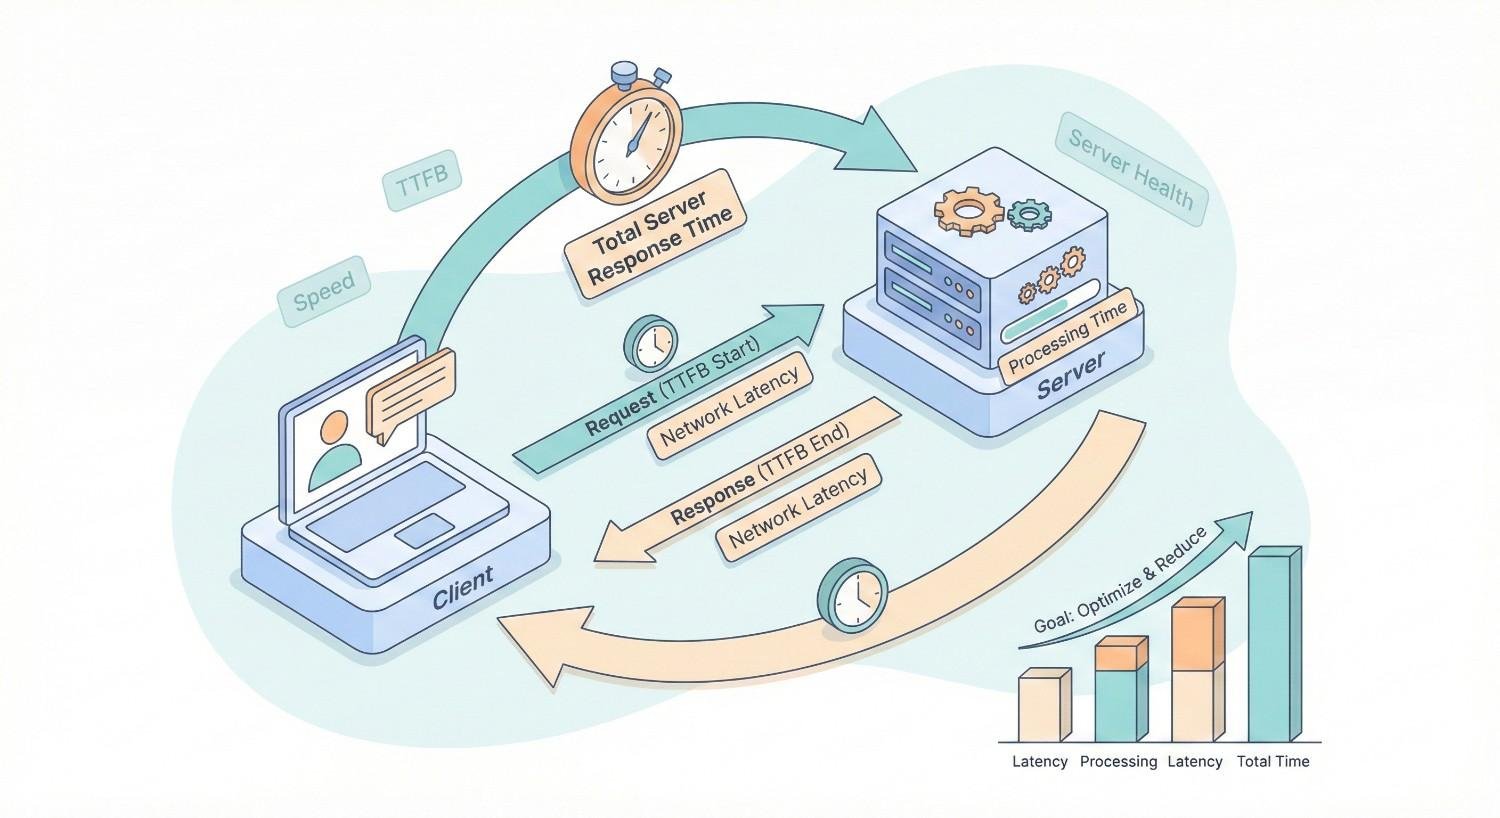
Time to First Byte represents the most common metric for measuring server response time. TTFB captures the duration between a user’s browser sending an HTTP request and receiving the first byte of data from your server.
This measurement includes three distinct phases. First, the DNS lookup translates your domain name into an IP address. Second, the connection establishment creates a secure link between browser and server. Third, the server processing time handles the actual request and begins sending data.
Google’s web.dev documentation identifies TTFB as a foundational metric that affects all subsequent loading phases. A high TTFB means your Largest Contentful Paint, First Input Delay, and other Core Web Vitals will struggle to meet thresholds.
For most websites, the server processing component dominates TTFB. This is where database queries run, server-side code executes, and dynamic content generates.
How Server Response Time Differs from Page Load Time
Server response time and page load time measure fundamentally different things. Understanding this distinction helps you diagnose performance issues accurately.
Server response time ends when the first byte arrives at the browser. Page load time continues until the entire page finishes rendering, including all images, scripts, stylesheets, and third-party resources.
A website might have excellent server response time but terrible page load time due to unoptimized images or render-blocking JavaScript. Conversely, a site with slow server response will always have slow page load time because everything waits for that initial response.
Consider this practical example. Your server responds in 150ms, which is excellent. But your page takes 8 seconds to fully load because of massive uncompressed images. The server did its job quickly. The front-end optimization failed.
When troubleshooting performance, always start with server response time. It sets the floor for how fast your page can possibly load.
Why Server Response Time Matters for SEO and Business Performance
Server response time sits at the intersection of technical SEO, user experience, and business outcomes. Improving this single metric creates cascading benefits across your entire digital presence.
Search engines use response time as a ranking signal. Users make split-second judgments about your brand based on loading speed. And conversion rates correlate directly with how quickly pages become interactive.
Impact on Core Web Vitals and Google Rankings
Google officially incorporated page experience signals into its ranking algorithm, with Core Web Vitals serving as the primary measurement framework. Server response time directly influences these metrics.
Largest Contentful Paint cannot occur until the server responds. If your TTFB is 800ms, your LCP will be at least 800ms plus rendering time. Google recommends LCP under 2.5 seconds for a “good” score. Slow server response consumes a significant portion of that budget.
First Input Delay and Interaction to Next Paint also suffer when servers respond slowly. The browser cannot process user interactions until it receives and parses the initial HTML document.
Beyond Core Web Vitals, server response time affects crawl efficiency. Googlebot has a crawl budget for each site. Slow responses mean fewer pages crawled per session. For large sites, this directly impacts how quickly new content gets indexed.
Search Engine Journal reports that page speed remains a confirmed ranking factor, with server response time being a critical component of overall speed.
Effect on User Experience and Bounce Rates
Users form opinions about your website within milliseconds. Slow server response creates an immediate negative impression before any content appears.
The psychological impact compounds quickly. A one-second delay feels noticeable. Two seconds feels slow. Three seconds triggers frustration. Beyond four seconds, users actively consider leaving.
Research from Google shows that as page load time increases from 1 to 3 seconds, bounce probability increases by 32%. From 1 to 5 seconds, that probability jumps to 90%.
Mobile users demonstrate even less patience. They often browse on slower connections with limited time. A server that responds quickly on desktop but slowly on mobile loses a significant portion of traffic.
The bounce rate impact extends beyond individual sessions. High bounce rates signal to search engines that users aren’t finding value, potentially affecting rankings over time.
Connection to Conversion Rates and Revenue
Every millisecond of delay costs money. This isn’t hyperbole. It’s documented across industries and business models.
Portent’s research found that website conversion rates drop by an average of 4.42% with each additional second of load time between seconds 0-5. For an e-commerce site generating $100,000 monthly, a one-second improvement could mean $4,420 in additional monthly revenue.
The impact varies by industry but remains consistent in direction. Faster sites convert better. Period.
Consider the user journey. Someone clicks your ad, arrives at a slow-loading page, and leaves before seeing your offer. You paid for that click. You lost that potential customer. And you gained nothing.
Server response time optimization delivers one of the highest ROI improvements in technical SEO. The investment is typically modest. The returns compound across every visitor, every page, every day.
What Causes Slow Server Response Time?
Diagnosing slow server response requires understanding the potential bottlenecks. Multiple factors can contribute, often simultaneously. Identifying the root cause determines the appropriate solution.
Most server response issues fall into five categories: hosting infrastructure, database performance, caching, code efficiency, and third-party dependencies.
Hosting Infrastructure Limitations
Your hosting environment establishes the baseline for server performance. No amount of optimization overcomes fundamentally inadequate infrastructure.
Shared hosting places your website on a server with hundreds of other sites. Resources get divided among all tenants. When a neighboring site experiences traffic spikes, your performance suffers. This unpredictability makes shared hosting unsuitable for business-critical websites.
Server location also matters significantly. A server in Virginia responding to a user in Tokyo adds latency from physical distance. Data travels at the speed of light, but crossing oceans still takes time.
Outdated server software creates performance penalties. Older PHP versions run slower than current releases. Unoptimized server configurations waste resources on unnecessary processes.
Hardware limitations cap performance regardless of software optimization. Insufficient RAM forces disk swapping. Slow processors bottleneck computation. Mechanical hard drives lag behind SSDs.
Unoptimized Database Queries
Dynamic websites rely on databases to store and retrieve content. Every page load triggers database queries. Inefficient queries create exponential slowdowns as traffic increases.
Common database issues include missing indexes, which force full table scans instead of targeted lookups. A query that should take 5ms might take 500ms without proper indexing.
Excessive queries compound the problem. A poorly designed page might execute 100 database calls when 10 would suffice. Each query adds latency, and the cumulative effect devastates response time.
Large databases without maintenance accumulate overhead. Orphaned data, fragmented tables, and bloated logs consume resources without providing value.
WordPress sites frequently suffer from database bloat. Post revisions, spam comments, transient options, and plugin data accumulate over years. Regular cleanup and optimization become essential.
Lack of Caching Mechanisms
Without caching, your server rebuilds every page from scratch for every visitor. This wastes computational resources and dramatically increases response time.
Server-side caching stores generated pages or page fragments for reuse. When the next visitor requests the same page, the server delivers the cached version instead of regenerating it.
Object caching stores database query results in memory. Repeated queries return instantly from cache rather than hitting the database again.
Opcode caching stores compiled PHP code. Without it, PHP files get parsed and compiled on every request. With it, the compiled version loads directly.
The absence of any caching layer means your server works maximally hard for every single request. This approach doesn’t scale and guarantees slow response times under any meaningful traffic.
Server-Side Code Inefficiencies
Poorly written backend code creates performance bottlenecks that no infrastructure upgrade can solve. The code itself becomes the limiting factor.
Synchronous operations that should be asynchronous block execution. A page that waits for an email to send before responding adds unnecessary seconds to every request.
Memory leaks gradually consume available resources until the server struggles. Inefficient loops process data slowly. Redundant operations repeat work unnecessarily.
Framework overhead adds baseline latency. Some content management systems and frameworks prioritize flexibility over performance. The abstraction layers that make development easier also make execution slower.
Legacy code often contains outdated practices. Functions deprecated for performance reasons continue running. Compatibility layers maintain support for features no longer used.
Third-Party Service Dependencies
External services introduce latency outside your control. Every API call, external script, or remote resource adds potential delay.
Payment processors, analytics platforms, social media widgets, and advertising networks all require external connections. If any service responds slowly, your page waits.
DNS lookups for third-party domains add latency. Each unique domain requires a separate lookup before the connection can establish.
The reliability of external services varies. A third-party outage can cascade into your site appearing slow or broken, even when your server performs perfectly.
Synchronous loading of external resources blocks page rendering. A slow-loading chat widget can delay your entire page if implemented incorrectly.
How to Measure Server Response Time
Accurate measurement precedes effective optimization. You cannot improve what you don’t measure, and you cannot prioritize without understanding current performance.
Multiple tools provide server response time data. Each offers different perspectives and capabilities. Using several tools together gives the most complete picture.
Using Google PageSpeed Insights
Google PageSpeed Insights provides the most authoritative measurement because it reflects how Google evaluates your site. The tool tests both mobile and desktop performance, providing separate scores and recommendations.
Access PageSpeed Insights at pagespeed.web.dev. Enter your URL and wait for the analysis to complete. The results include both lab data from controlled testing and field data from real user experiences.
Look for the “Time to First Byte” metric in the diagnostics section. PageSpeed Insights flags TTFB issues when response time exceeds recommended thresholds.
The field data section shows how real visitors experience your site. This data comes from the Chrome User Experience Report and reflects actual performance across different devices, connections, and locations.
Pay attention to the “Reduce server response times” opportunity if it appears. This indicates Google has identified TTFB as a significant issue for your site.
Testing with GTmetrix and WebPageTest
GTmetrix combines Google Lighthouse analysis with additional performance metrics. The free tier allows testing from multiple locations, helping identify geographic performance variations.
GTmetrix displays TTFB prominently in its summary. The waterfall chart shows exactly how long the server took to respond before any other resources loaded.
WebPageTest offers the most detailed analysis available. You can test from dozens of global locations, simulate various connection speeds, and run multiple test runs for consistency.
WebPageTest’s waterfall view breaks down every millisecond of the loading process. The first row shows your HTML document, with TTFB clearly marked. You can see DNS lookup time, connection time, SSL negotiation, and server processing separately.
Run tests from locations where your actual users browse. A site serving Australian customers should test from Australian servers, not just US locations.
Monitoring with Google Search Console
Google Search Console provides ongoing performance monitoring rather than point-in-time testing. The Core Web Vitals report shows how Google perceives your site’s performance over time.
Navigate to the Core Web Vitals section in Search Console. The report categorizes URLs as Good, Needs Improvement, or Poor based on field data from real users.
While Search Console doesn’t display TTFB directly, poor LCP scores often indicate server response issues. Click into specific URL groups to see which pages need attention.
The Page Experience report combines Core Web Vitals with other signals. Tracking this report over time shows whether your optimization efforts produce results.
Set up email alerts for significant changes. Search Console can notify you when performance degrades, allowing quick response before rankings suffer.
Setting Performance Benchmarks
Benchmarks provide targets for optimization and context for current performance. Without benchmarks, you cannot determine whether your server response time is acceptable.
Google recommends TTFB under 800ms for a “good” rating. Under 1800ms is “needs improvement.” Above 1800ms is “poor.” These thresholds apply to the 75th percentile of page loads.
However, competitive benchmarks matter more than absolute thresholds. If your competitors respond in 200ms and you respond in 700ms, you’re at a disadvantage even though 700ms technically passes Google’s threshold.
Establish baseline measurements before making changes. Test multiple pages across your site. Test at different times of day. Test from multiple locations. This baseline enables accurate before-and-after comparisons.
Document your benchmarks and review them monthly. Server performance can degrade gradually as databases grow, traffic increases, or hosting resources become constrained.
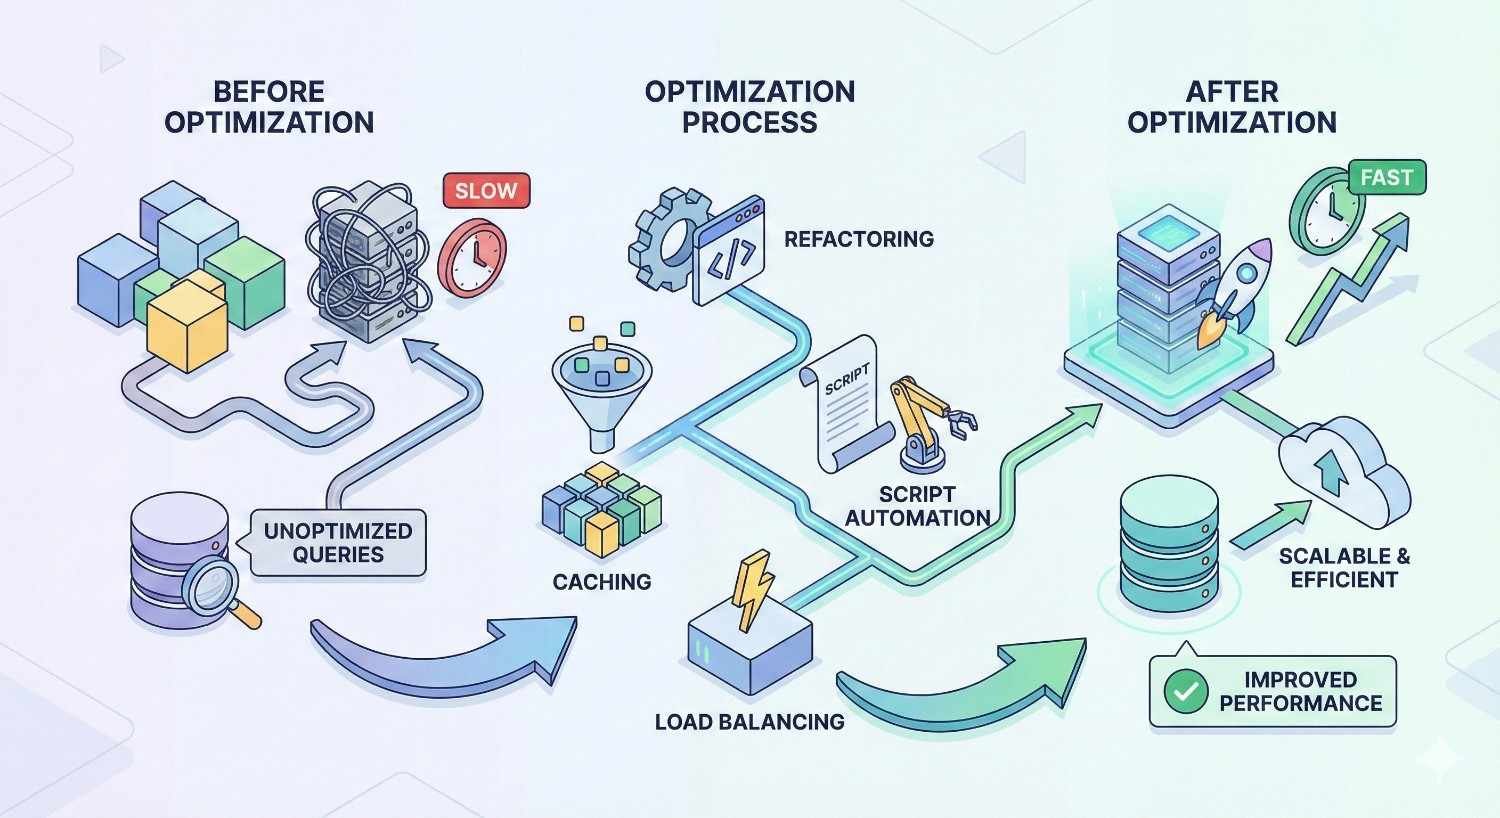
How to Optimize Server Response Time
Optimization strategies range from simple configuration changes to significant infrastructure investments. Start with high-impact, low-effort improvements before tackling complex solutions.
The following strategies address the root causes identified earlier. Implement them systematically, measuring impact after each change.
Upgrade to Quality Hosting (Shared vs VPS vs Dedicated vs Cloud)
Hosting upgrades often deliver the most dramatic improvements. If your current hosting limits performance, no other optimization can compensate.
Shared hosting suits small personal sites with minimal traffic. Business websites should avoid shared hosting due to unpredictable performance and limited resources.
VPS (Virtual Private Server) provides dedicated resources within a virtualized environment. You get guaranteed CPU, RAM, and storage without sharing with other tenants. VPS offers a significant upgrade from shared hosting at moderate cost.
Dedicated servers provide an entire physical machine for your site alone. Maximum performance and control come with higher costs and management responsibility.
Cloud hosting from providers like AWS, Google Cloud, or Azure offers scalability and global distribution. Resources scale automatically with demand. Geographic distribution reduces latency for global audiences.
When evaluating hosts, consider server location relative to your audience, SSD storage, modern PHP versions, HTTP/2 support, and uptime guarantees. Read reviews focusing on performance, not just features.
Implement Server-Side Caching
Caching transforms server response time by eliminating redundant processing. Properly configured caching can reduce response time by 80% or more.
Page caching stores complete HTML pages. When a visitor requests a cached page, the server delivers it instantly without executing PHP or querying databases. WordPress plugins like WP Super Cache or W3 Total Cache implement page caching.
Object caching stores database query results in memory using systems like Redis or Memcached. Repeated queries return from memory in microseconds rather than hitting the database.
Opcode caching through OPcache stores compiled PHP bytecode. PHP doesn’t need to parse and compile scripts on every request. Most modern hosting enables OPcache by default.
Configure cache expiration appropriately. Static content can cache for days or weeks. Dynamic content might cache for minutes or hours. Find the balance between freshness and performance.
Implement cache invalidation to ensure updates appear promptly. When you publish new content, the cache should clear automatically for affected pages.
Use a Content Delivery Network (CDN)
CDNs distribute your content across global server networks. Visitors receive content from the nearest geographic location, dramatically reducing latency.
Major CDN providers include Cloudflare, Fastly, Amazon CloudFront, and Akamai. Cloudflare offers a generous free tier suitable for many websites.
CDNs cache static assets like images, CSS, and JavaScript at edge locations worldwide. Some CDNs also cache HTML pages, effectively providing page caching at the network edge.
Beyond caching, CDNs provide additional benefits. DDoS protection absorbs malicious traffic before it reaches your server. SSL termination at the edge reduces server load. HTTP/2 and HTTP/3 support improves connection efficiency.
Implementation typically involves changing DNS settings to route traffic through the CDN. The CDN then fetches content from your origin server and caches it for subsequent requests.
Optimize Database Performance
Database optimization addresses one of the most common causes of slow server response. Even small improvements compound across thousands of daily queries.
Add indexes to frequently queried columns. Indexes allow the database to locate records without scanning entire tables. Analyze slow query logs to identify candidates for indexing.
Optimize tables regularly to reclaim space and improve efficiency. In MySQL, the OPTIMIZE TABLE command defragments tables and updates index statistics.
Clean unnecessary data including post revisions, spam comments, expired transients, and orphaned metadata. WordPress databases accumulate significant bloat over time.
Use query caching to store results of repeated queries. MySQL’s query cache or application-level caching reduces database load.
Consider database server upgrades if queries remain slow after optimization. More RAM allows larger datasets to remain in memory. Faster storage reduces disk I/O latency.
Enable Compression (Gzip/Brotli)
Compression reduces the size of data transferred between server and browser. Smaller responses transmit faster, improving perceived response time.
Gzip compression is universally supported and reduces text-based files by 70-90%. HTML, CSS, JavaScript, and JSON all compress effectively.
Brotli compression offers better compression ratios than Gzip with similar decompression speed. Modern browsers support Brotli, though Gzip remains the fallback.
Enable compression at the server level through Apache’s mod_deflate or Nginx’s gzip module. Most hosting control panels provide compression toggles.
Verify compression is working using browser developer tools or online testing tools. The response headers should show Content-Encoding: gzip or Content-Encoding: br.
Don’t compress already-compressed files like images, videos, or PDFs. The processing overhead provides no benefit for these formats.
Reduce Server-Side Redirects
Each redirect adds a complete round-trip between browser and server. Multiple redirects chain together, multiplying latency.
Common redirect chains include HTTP to HTTPS, non-www to www (or vice versa), and trailing slash normalization. A request might redirect three times before reaching the final URL.
Audit your redirect chains using tools like Screaming Frog or redirect checker websites. Identify chains and eliminate intermediate steps.
Update internal links to point directly to final URLs. If your canonical URL is https://www.example.com/page/, link to that exact URL rather than http://example.com/page.
Configure redirects at the server level rather than through application code. Server-level redirects execute faster and consume fewer resources.
Optimize Backend Code and Scripts
Code optimization requires technical expertise but delivers lasting improvements. Efficient code runs faster regardless of hosting environment.
Profile your application to identify slow functions and bottlenecks. PHP profilers like Xdebug or Blackfire reveal exactly where time is spent.
Reduce external API calls during page generation. Cache API responses when possible. Make calls asynchronous when real-time data isn’t required.
Optimize autoloading to load only necessary classes. Composer’s optimized autoloader improves PHP application performance.
Update to current language versions. PHP 8.x runs significantly faster than PHP 7.x, which runs faster than PHP 5.x. Framework updates often include performance improvements.
Remove unused plugins and modules. Each active plugin adds overhead even if its features aren’t used on a particular page.
What Is a Good Server Response Time? (Benchmarks and Standards)
Understanding performance benchmarks helps you set realistic goals and prioritize optimization efforts. Different contexts require different standards.
Google’s Recommended TTFB Threshold
Google’s official guidance establishes clear performance tiers for TTFB measurement.
Good: Under 800ms at the 75th percentile. This means 75% of your page loads should have TTFB below 800ms.
Needs Improvement: Between 800ms and 1800ms. Performance in this range won’t severely penalize rankings but leaves room for improvement.
Poor: Above 1800ms. Sites in this range likely experience ranking penalties and significant user experience issues.
These thresholds apply to field data from real users, not lab tests. Your actual performance varies based on user location, device, and connection quality.
Aim for significantly better than the “good” threshold. A 200-400ms TTFB provides comfortable margin and competitive advantage.
Industry Benchmarks by Website Type
Different website types face different performance challenges and expectations.
E-commerce sites should target TTFB under 400ms. Shopping behavior is impatient. Slow product pages directly reduce sales. Amazon famously found that every 100ms of latency cost 1% in sales.
Content publishers can tolerate slightly higher TTFB, around 500-600ms, because users expect to wait briefly for articles. However, faster remains better for engagement and ad revenue.
SaaS applications require fast response for user satisfaction. Dashboard and application pages should respond under 300ms to feel responsive.
Local business sites often have simpler requirements but still benefit from fast response. Mobile users searching for nearby services expect quick results.
Compare your performance against direct competitors. Use tools like GTmetrix to test competitor sites from the same location. Your goal is to match or exceed their performance.
Server Response Time Optimization for Different Platforms
Platform-specific considerations affect optimization strategies. What works for WordPress differs from Shopify or custom applications.
WordPress Server Response Optimization
WordPress powers over 40% of websites, making it the most common optimization target. The platform’s flexibility creates performance challenges that require specific solutions.
Choose lightweight themes built for performance. Bloated themes with dozens of features you don’t use slow every page load. Theme frameworks like GeneratePress or Flavor prioritize speed.
Limit active plugins to essential functionality. Each plugin adds database queries, file includes, and processing overhead. Audit plugins quarterly and remove unused ones.
Implement WordPress-specific caching through plugins like WP Rocket, W3 Total Cache, or LiteSpeed Cache. These plugins handle page caching, object caching, and browser caching in WordPress-friendly ways.
Use a WordPress-optimized host. Managed WordPress hosts like WP Engine, Kinsta, or Cloudways configure servers specifically for WordPress performance.
Disable unnecessary features like XML-RPC, pingbacks, and emoji scripts if you don’t use them. Small optimizations accumulate into meaningful improvements.
Shopify and E-commerce Platforms
Hosted platforms like Shopify limit server-side optimization options. Focus on what you can control.
Choose performance-optimized themes. Shopify’s theme store includes performance ratings. Avoid themes with excessive features and animations.
Minimize apps installed on your store. Each app potentially adds scripts, stylesheets, and processing overhead. Remove apps you’re not actively using.
Optimize images before uploading. Shopify processes images, but starting with optimized files reduces processing time and storage.
Use Shopify’s built-in CDN effectively. Ensure assets load from Shopify’s CDN rather than external sources when possible.
Monitor third-party scripts from payment processors, reviews, and marketing tools. These scripts often cause the most significant performance impact on Shopify stores.
Custom-Built Websites and Applications
Custom applications offer maximum optimization potential but require technical expertise to implement.
Profile before optimizing. Use APM tools like New Relic, Datadog, or open-source alternatives to identify actual bottlenecks rather than guessing.
Implement application-level caching appropriate to your framework. Laravel has built-in caching. Node.js applications can use Redis. Choose caching strategies that match your data patterns.
Optimize database queries through query analysis and indexing. ORMs sometimes generate inefficient queries that manual optimization can improve.
Consider architectural changes for persistent performance issues. Microservices, queue-based processing, or read replicas might solve problems that code optimization cannot.
Load test regularly to identify performance degradation before users experience it. Tools like k6, Locust, or Apache JMeter simulate traffic loads.
Common Server Response Time Optimization Mistakes to Avoid
Optimization efforts sometimes backfire or miss the mark entirely. Avoid these common mistakes to ensure your efforts produce results.
Over-Reliance on Plugins and Extensions
Plugins promise easy optimization but often create new problems. The irony of installing a performance plugin that slows your site is common.
Each plugin adds code that executes on every page load. A caching plugin that adds 50ms of processing overhead while saving 200ms through caching provides net benefit. A plugin that adds 50ms while providing minimal benefit makes things worse.
Plugin conflicts create unpredictable behavior. Two caching plugins fighting each other can cause worse performance than no caching at all.
Evaluate plugins critically. Test performance before and after installation. Remove plugins that don’t demonstrate clear improvement.
Consider server-level solutions over plugin-based ones when possible. Server-level caching through Varnish or LiteSpeed outperforms plugin-based caching in most cases.
Ignoring Mobile Server Performance
Mobile users often experience worse server response than desktop users, yet mobile traffic dominates most websites.
Mobile networks add latency that compounds slow server response. A 500ms server response becomes 800ms or more over cellular connections.
Test specifically from mobile devices and mobile network conditions. Tools like WebPageTest allow mobile device emulation and network throttling.
Ensure your server handles mobile requests efficiently. Some configurations serve different content to mobile users, potentially with different performance characteristics.
Google’s mobile-first indexing means mobile performance directly affects rankings. Desktop performance matters less than mobile for most sites.
Neglecting Ongoing Monitoring
One-time optimization degrades over time. Databases grow. Traffic patterns change. Software updates introduce regressions.
Implement continuous monitoring to catch performance degradation early. Services like Pingdom, UptimeRobot, or StatusCake provide ongoing performance tracking.
Set up alerts for performance thresholds. Know immediately when response time exceeds acceptable limits rather than discovering problems through ranking drops.
Schedule regular performance audits. Monthly reviews catch gradual degradation before it becomes severe.
Track performance alongside business metrics. Correlate response time changes with traffic, conversions, and revenue to demonstrate optimization ROI.
How Long Does It Take to See SEO Results from Server Optimization?
Server response time improvements produce both immediate and long-term benefits. Understanding the timeline helps set appropriate expectations.
Immediate vs Long-Term Performance Gains
Immediate benefits appear as soon as optimization deploys. Users experience faster loading instantly. Bounce rates may improve within days as users encounter better performance.
Core Web Vitals field data updates over a 28-day rolling window. Significant improvements should reflect in Search Console within 4-6 weeks as new data replaces old measurements.
Ranking improvements take longer to materialize. Google doesn’t re-evaluate rankings instantly when performance improves. Expect 2-4 months before performance improvements translate into ranking changes.
The magnitude of improvement matters. Moving from “poor” to “good” Core Web Vitals produces more noticeable ranking impact than moving from “good” to “excellent.”
Competitive context affects timelines. If competitors also optimize, relative advantage may not change despite absolute improvement.
Tracking Improvements in Search Rankings
Isolate performance changes from other variables when tracking results. If you simultaneously improve server response and publish new content, attributing ranking changes becomes difficult.
Monitor specific pages rather than site-wide averages. Pages with the most significant performance improvements should show the clearest ranking changes.
Track rankings for keywords where you’re already competitive. Performance improvements help pages ranking positions 5-15 more than pages ranking position 50+.
Use Search Console’s performance report to track impressions and clicks over time. Improved performance should correlate with increased visibility.
Document baseline metrics before optimization. Without clear before-and-after data, demonstrating improvement becomes impossible.
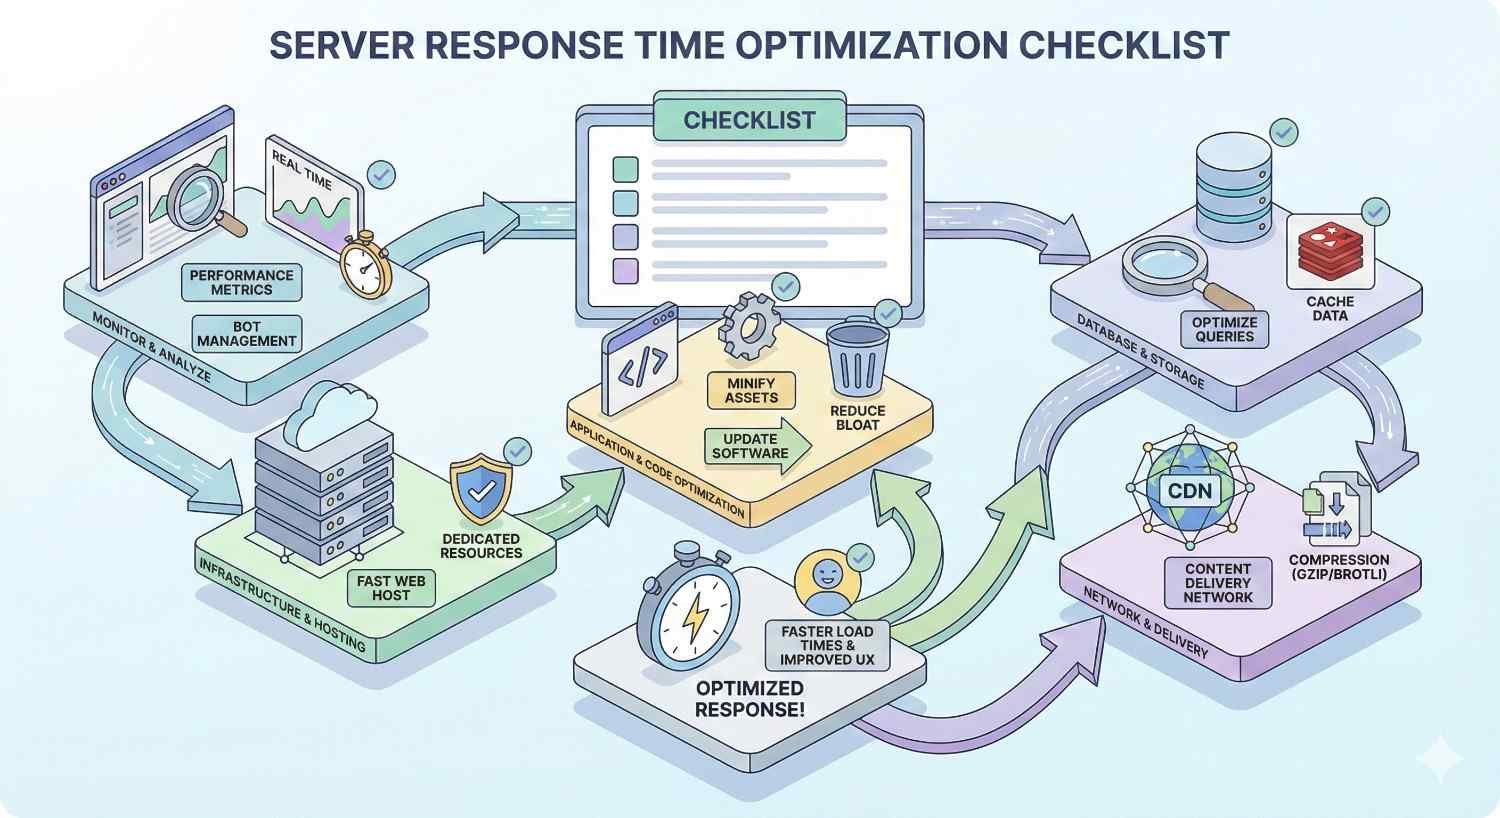
Server Response Time Optimization Checklist
Use this checklist to systematically address server response time issues.
Measurement and Baseline:
- Test current TTFB using PageSpeed Insights, GTmetrix, and WebPageTest
- Document baseline performance for key pages
- Identify pages with worst performance for priority attention
- Set target TTFB goals based on benchmarks and competition
Hosting and Infrastructure:
- Evaluate current hosting against performance requirements
- Consider upgrading from shared to VPS or cloud hosting
- Verify server location aligns with target audience geography
- Confirm modern PHP version and server software
Caching Implementation:
- Enable page caching at server or application level
- Implement object caching with Redis or Memcached
- Verify opcode caching is active
- Configure appropriate cache expiration times
Database Optimization:
- Analyze and optimize slow queries
- Add indexes to frequently queried columns
- Clean unnecessary data and optimize tables
- Schedule regular database maintenance
Code and Configuration:
- Enable Gzip or Brotli compression
- Eliminate unnecessary redirects
- Remove unused plugins and modules
- Update to current software versions
CDN and Distribution:
- Implement CDN for static asset delivery
- Configure CDN caching rules appropriately
- Test performance from multiple geographic locations
Ongoing Monitoring:
- Set up continuous performance monitoring
- Configure alerts for performance degradation
- Schedule monthly performance reviews
- Track correlation with business metrics
Conclusion
Server response time optimization delivers measurable improvements to search rankings, user experience, and conversion rates. The technical investment pays dividends across every visitor interaction.
At White Label SEO Service, we help businesses identify and resolve server performance issues as part of comprehensive technical SEO strategies. Our team combines deep technical expertise with clear communication to deliver results you can measure.
Contact us to audit your current server performance and develop an optimization roadmap tailored to your platform, audience, and business goals.
Frequently Asked Questions About Server Response Time
Does server response time affect SEO?
Yes, server response time directly affects SEO through Core Web Vitals and crawl efficiency. Google uses page experience signals including TTFB as ranking factors. Slow server response also limits how many pages Googlebot can crawl during each session, potentially delaying indexation of new content.
How do I reduce TTFB on WordPress?
Reduce WordPress TTFB by implementing caching plugins like WP Rocket, upgrading to quality managed WordPress hosting, optimizing your database, using a lightweight theme, and minimizing active plugins. Server-level caching through LiteSpeed or Varnish provides additional improvement beyond plugin-based solutions.
What causes high server response time?
High server response time typically results from inadequate hosting infrastructure, unoptimized database queries, lack of caching, inefficient server-side code, or slow third-party service dependencies. Often multiple factors combine to create slow response. Systematic diagnosis identifies which factors contribute most to your specific situation.
Is 200ms a good server response time?
A 200ms server response time is excellent and significantly better than Google’s 800ms threshold for “good” performance. This response time provides competitive advantage and comfortable margin for additional page rendering. Most well-optimized sites with quality hosting achieve TTFB between 100-400ms.
Can a CDN improve server response time?
CDNs improve perceived server response time by caching content at edge locations closer to users. While the origin server response time remains unchanged, users receive cached content from nearby servers with much lower latency. CDNs also reduce load on origin servers, potentially improving response time for uncached requests.
How often should I monitor server response time?
Monitor server response time continuously through automated tools with alerts for threshold violations. Conduct detailed manual audits monthly to catch gradual degradation and identify optimization opportunities. Increase monitoring frequency during traffic spikes, after deployments, or when making infrastructure changes.
Does server location affect response time?
Server location significantly affects response time due to physical distance and network routing. Data traveling from a US server to an Australian user adds 150-300ms of latency compared to a local server. CDNs mitigate this by caching content at edge locations, but origin server location still matters for dynamic content and cache misses.


