
Infographic link building remains one of the most effective white-hat strategies for earning high-quality backlinks at scale. A single well-designed infographic can generate dozens of editorial links from authoritative websites, driving both referral traffic and domain authority improvements that compound over time.
Visual content earns backlinks because publishers need engaging assets to enhance their articles. When you create data-driven infographics that solve this problem, you position your brand as a resource worth citing and linking to repeatedly.
This guide covers everything from infographic creation and SEO optimization to outreach strategies, performance tracking, and realistic ROI expectations. You’ll learn exactly how to build a sustainable infographic link building campaign that delivers measurable results.
What Is Infographic Link Building?
Infographic link building is a content marketing strategy that uses visual data representations to attract backlinks from other websites. The approach combines graphic design, data journalism, and outreach to earn editorial links naturally.
Unlike traditional link building tactics that rely on direct requests or exchanges, infographic link building provides genuine value to publishers. Website owners embed your infographic because it enhances their content, not because you asked for a favor.
The strategy works across virtually every industry. B2B companies use infographics to visualize complex processes. E-commerce brands create product comparison graphics. SaaS companies illustrate industry trends. The format adapts to any topic where data can tell a compelling visual story.
How Infographic Link Building Works
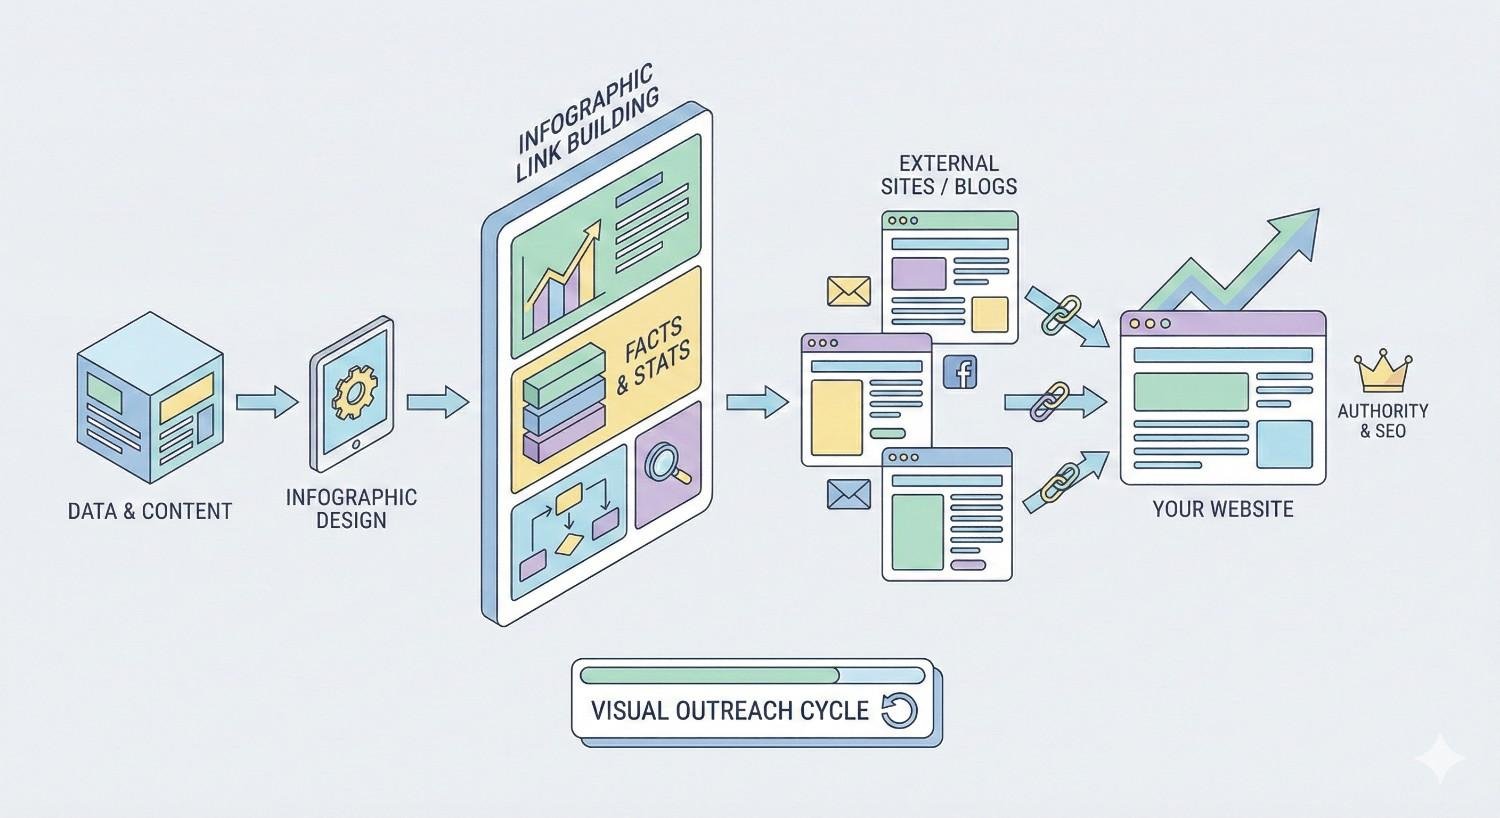
The process follows a predictable workflow. First, you research topics with high link potential and gather credible data. Then, you design an infographic that presents this information in a visually compelling format.
Once published on your website with proper optimization, you begin outreach. This involves identifying websites that cover related topics and would benefit from embedding your infographic. You contact editors, bloggers, and content managers with a personalized pitch.
When a publisher decides to use your infographic, they typically embed it using code you provide. This embed code includes an attribution link back to your original source, creating a backlink. The link passes authority to your domain while the publisher gets valuable visual content.
The cycle continues as other websites discover the infographic organically. Social shares increase visibility. Other publishers find it through search. Each new placement potentially generates additional backlinks without further outreach effort.
Why Infographics Attract Backlinks
Human brains process visual information 60,000 times faster than text, according to research from MIT. This biological reality explains why infographics consistently outperform text-only content for link acquisition.
Publishers face constant pressure to create engaging content. Original graphics require design resources many websites lack. When you offer a professionally designed infographic that fits their topic, you solve a real problem.
Data visualization also builds credibility. Readers trust information presented with clear sources and professional design more than unsupported claims. Publishers want this credibility boost for their own content.
The shareability factor amplifies results. Infographics perform exceptionally well on social platforms, particularly Pinterest, LinkedIn, and Twitter. Each share increases exposure to potential linkers who might never have found your content through search alone.
Finally, infographics have longevity. A well-researched infographic on an evergreen topic continues attracting links for years. The initial investment pays dividends long after publication.
Benefits of Infographic Link Building for SEO
Infographic link building delivers multiple SEO benefits beyond simple backlink counts. Understanding these advantages helps you build a business case for investment and set appropriate expectations.
The strategy aligns perfectly with Google’s emphasis on helpful content and natural link profiles. You’re creating something genuinely useful, then promoting it to relevant audiences. This approach builds sustainable authority rather than gaming algorithms.
High-Quality Backlink Acquisition
Infographic links typically come from editorial contexts. A blogger writes about your topic, finds your infographic valuable, and embeds it with attribution. This editorial placement signals relevance and quality to search engines.
The diversity of linking domains also improves your backlink profile. A successful infographic campaign generates links from various website types: industry blogs, news sites, educational resources, and niche publications. This diversity looks natural to Google’s algorithms.
Link velocity matters too. Infographics can generate multiple links quickly after launch, then continue earning links gradually over time. This pattern mimics how genuinely valuable content naturally attracts attention.
According to Backlinko’s analysis of link building strategies, visual assets like infographics consistently rank among the most effective tactics for earning editorial backlinks from high-authority domains.
Brand Visibility and Authority Building
Every infographic placement puts your brand in front of new audiences. When a major industry publication embeds your graphic, their readers see your logo and attribution. This exposure builds recognition over time.
The association with quality content strengthens brand perception. If your infographics consistently provide accurate, well-designed information, publishers and readers begin viewing your brand as an authority. This perception influences future linking decisions and customer trust.
Infographics also support thought leadership positioning. Creating original research and presenting it professionally demonstrates expertise. Industry peers take notice. Speaking opportunities, partnership inquiries, and media mentions often follow successful infographic campaigns.
Increased Referral Traffic and Social Shares
Backlinks from relevant websites drive qualified referral traffic. Visitors who click through from an industry blog are already interested in your topic. They’re more likely to explore your site, subscribe to content, or convert than random visitors.
Social sharing multiplies reach exponentially. One share from an influential account can trigger a cascade of additional shares. BuzzSumo research shows that infographics are among the most shared content formats on social media, particularly on visual platforms.
This traffic and social activity sends positive engagement signals. Users who arrive via infographic links often spend more time on site exploring related content. These behavioral metrics indirectly support SEO performance.
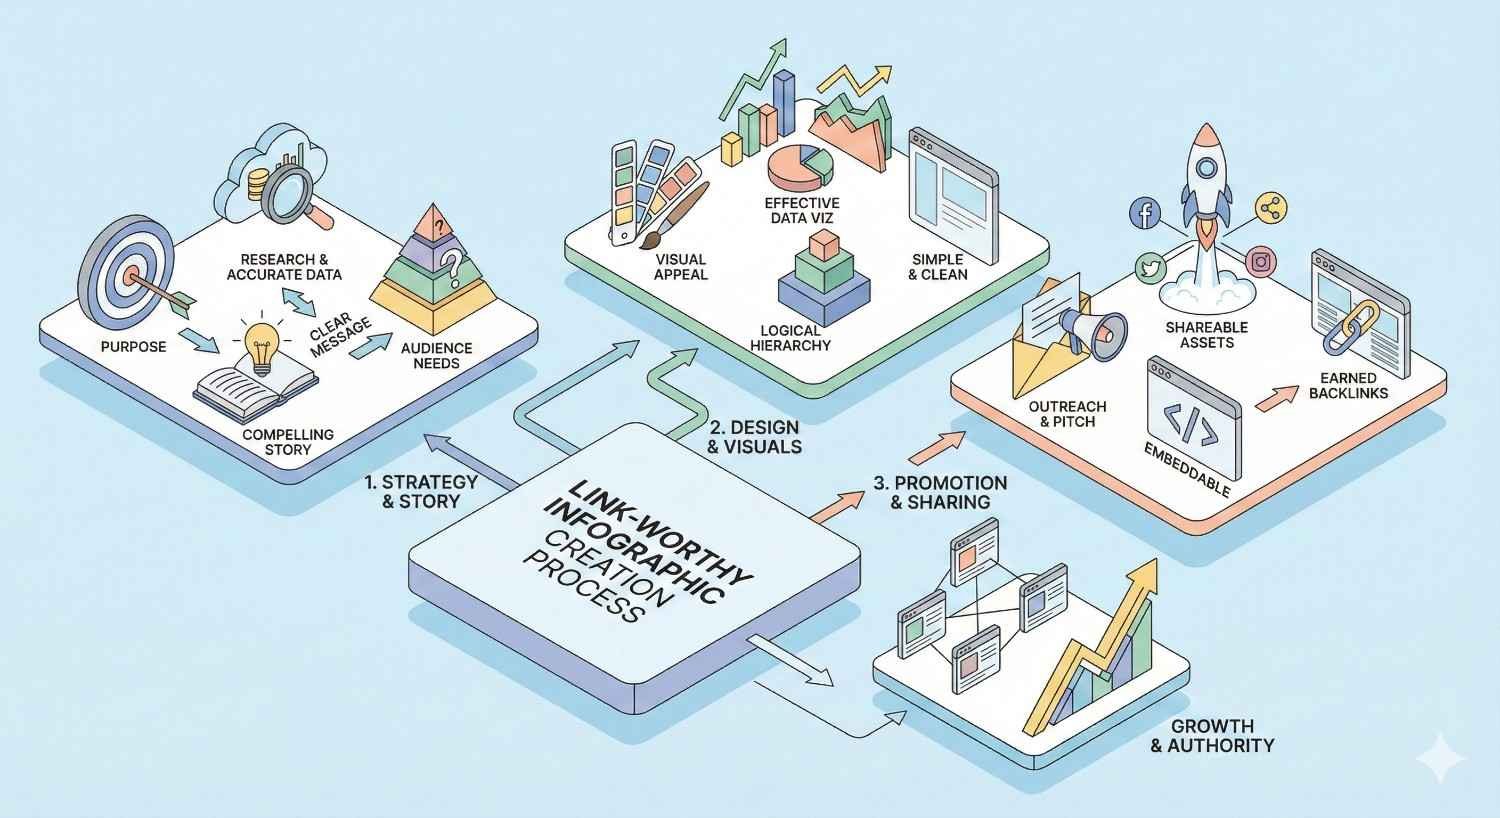
How to Create Link-Worthy Infographics
Not every infographic earns links. The difference between success and failure lies in strategic topic selection, professional design, compelling copy, and proper optimization. Each element must work together.
Creating link-worthy infographics requires upfront investment in research and planning. Rushing this phase produces mediocre results. Take time to validate your concept before committing design resources.
Researching Data-Driven Topics
Start with topics that have proven link potential. Use tools like Ahrefs or Semrush to analyze which infographics in your industry have earned the most backlinks. Look for patterns in successful topics.
Identify data gaps in your niche. What questions do people ask that lack good visual answers? What complex processes could benefit from visualization? What statistics are frequently cited but never illustrated?
Validate demand through keyword research. Topics with search volume indicate ongoing interest. An infographic targeting “content marketing statistics 2025” will have more link potential than an obscure topic nobody searches for.
Original research dramatically increases link potential. Surveys, data analysis, and proprietary insights give publishers something they can’t find elsewhere. Content Marketing Institute reports that original research consistently outperforms curated content for backlink acquisition.
Consider timeliness. Annual statistics roundups, trend predictions, and event-related infographics have natural promotion windows. Plan your content calendar around these opportunities.
Designing for Visual Impact and Shareability
Professional design separates link-worthy infographics from forgettable ones. If you lack in-house design capabilities, invest in a skilled freelancer or agency. Poor design undermines even the best data.
Follow visual hierarchy principles. Guide the viewer’s eye from top to bottom with clear sections, consistent styling, and logical flow. Each section should stand alone while contributing to the overall narrative.
Choose colors strategically. Your brand colors should appear, but readability comes first. High contrast between text and backgrounds ensures accessibility. Limit your palette to avoid visual chaos.
Optimize dimensions for sharing. Vertical infographics work best for Pinterest and blog embeds. Consider creating multiple versions: a full-length version for your site and cropped sections for social sharing.
Include your logo and URL prominently but not intrusively. When the infographic gets shared without context, viewers should still be able to find the source. This branding also reinforces attribution when publishers embed your content.
Writing Compelling Infographic Copy
Every word on an infographic must earn its place. Space is limited. Readers scan quickly. Write headlines that communicate value instantly.
Lead with your most surprising or valuable statistic. The opening section determines whether viewers continue scrolling. Front-load the insight that makes people say “I didn’t know that.”
Use active voice and present tense. “Companies lose $X annually” hits harder than “It has been estimated that losses may reach $X.” Direct language creates urgency and clarity.
Cite sources visibly. Include abbreviated citations near each statistic. This builds credibility and helps publishers verify accuracy before embedding. A “Sources” section at the bottom should list full references.
Write a compelling title that includes your target keyword naturally. The title appears in search results, social shares, and embed codes. Make it descriptive and benefit-focused.
Optimizing Infographics for Search Engines
Search engines can’t read images directly. Proper optimization ensures your infographic appears in both image search and regular results.
Write comprehensive alt text describing the infographic’s content and key statistics. This helps visually impaired users and provides context for search crawlers. Include your primary keyword naturally.
Create a dedicated landing page for each infographic. Don’t just upload an image. Write 300-500 words of supporting content that introduces the topic, summarizes key findings, and provides context search engines can index.
Use descriptive file names. “infographic-link-building-statistics-2025.png” tells search engines more than “image1.png.” Include relevant keywords without stuffing.
Implement proper schema markup. ImageObject schema helps search engines understand your content type. Article schema on the landing page provides additional context about the topic and publisher.
Compress images for fast loading without sacrificing quality. Page speed affects rankings. Tools like TinyPNG or ImageOptim reduce file sizes significantly while maintaining visual fidelity.
Infographic Link Building Outreach Strategies
Creating an excellent infographic is only half the battle. Without strategic outreach, even the best visual content sits unnoticed. Proactive promotion accelerates link acquisition and maximizes ROI.
Effective outreach requires research, personalization, and persistence. Mass emails to generic addresses rarely work. Targeted pitches to relevant contacts generate results.
Building a Targeted Outreach List
Start by identifying websites that have linked to similar infographics. Use Ahrefs, Moz, or Semrush to find backlinks pointing to competitor infographics. These publishers have already demonstrated willingness to embed visual content.
Expand your list with topic-relevant blogs and publications. Search for articles covering your infographic’s subject matter. Writers who recently published related content are ideal targets because your infographic could enhance their existing work.
Find the right contact at each publication. Generic “info@” addresses go nowhere. Look for content managers, editors, or the specific writer who covers your topic. LinkedIn, Twitter, and author bios help identify decision-makers.
Segment your list by priority. High-authority sites with engaged audiences deserve more personalized outreach. Lower-priority targets can receive templated pitches with light customization.
Build relationships before pitching when possible. Follow prospects on social media. Share their content. Leave thoughtful comments. When you eventually pitch, you’re not a stranger.
Crafting Effective Outreach Emails
Subject lines determine whether emails get opened. Keep them short, specific, and curiosity-inducing. “Infographic for your [topic] article” outperforms generic alternatives.
Open with genuine personalization. Reference a specific article they wrote. Mention something you appreciated about their work. This proves you’re not mass-emailing and increases response rates.
Explain the value proposition quickly. What does your infographic offer their readers? Why would embedding it improve their content? Focus on their benefit, not your link-building goals.
Include a direct link to the infographic and offer the embed code. Make saying yes as easy as possible. Remove friction from the process.
Keep emails concise. Three to four short paragraphs maximum. Busy editors won’t read lengthy pitches. Get to the point, demonstrate value, and make your ask clear.
Follow up strategically. One follow-up email after 5-7 days is appropriate. More than two follow-ups crosses into annoyance. Accept non-responses gracefully and move on.
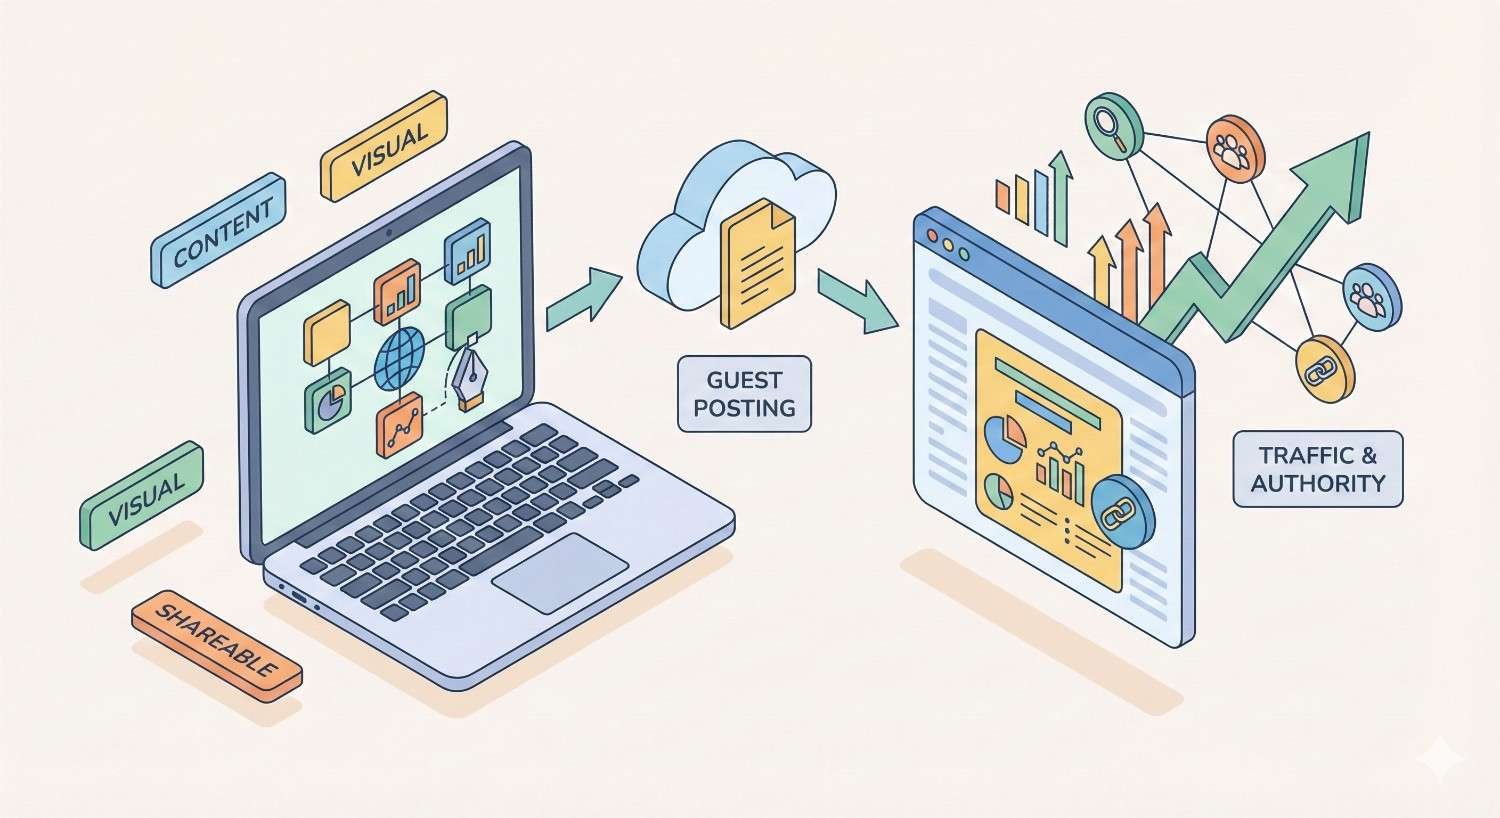
Guest Posting with Infographics
Guest posting combined with infographics creates powerful synergy. You provide valuable content to the host site while naturally incorporating your visual asset.
Pitch article ideas that genuinely require visual support. “10 Statistics About [Topic]” naturally calls for an infographic. The visual becomes integral to the content rather than a forced addition.
Negotiate infographic inclusion during the pitch phase. Some publications have policies about embedded content. Clarify expectations before writing to avoid wasted effort.
Write exceptional guest content. The article should stand on its own merits. Publishers accept guest posts because they provide value to readers, not because they want to help your link building.
Include your infographic with proper attribution linking back to your site. The embed code should contain your target URL. This creates a contextual backlink within relevant content.
Build ongoing relationships with publications that accept your guest posts. Repeat contributors often receive preferential treatment for future pitches.
Leveraging Infographic Submission Sites
Infographic directories and submission sites provide additional exposure and backlinks. While these links carry less weight than editorial placements, they contribute to a natural link profile.
Focus on quality directories with editorial standards. Sites like Visual.ly, Infographic Journal, and Daily Infographic review submissions before publishing. These curated platforms pass more value than spam-filled directories.
Optimize your submission with compelling titles and descriptions. Many directories display your content alongside competitors. Stand out with clear value propositions and professional presentation.
Include relevant categories and tags. Proper categorization helps users discover your infographic through browsing and search within the platform.
Don’t rely solely on submission sites. They supplement outreach efforts but shouldn’t replace direct publisher contact. The highest-value links come from editorial placements on relevant industry sites.
Track which submission sites drive actual traffic and links. Focus future efforts on platforms that deliver results rather than submitting everywhere indiscriminately.
Infographic Link Building Best Practices
Following established best practices maximizes campaign effectiveness while avoiding common pitfalls. These guidelines apply whether you’re running campaigns in-house or working with an agency.
Consistency matters more than occasional brilliance. A steady cadence of quality infographics builds momentum over time. One viral hit followed by months of silence wastes the authority you’ve built.
Embed Codes and Attribution Links
Provide ready-to-use embed codes on your infographic landing page. Publishers appreciate convenience. The easier you make embedding, the more likely they’ll use your graphic.
Structure embed codes to include attribution links automatically. When someone copies your embed code, the resulting HTML should contain a link back to your source page. This ensures you receive credit even from publishers who don’t manually add attribution.
Use descriptive anchor text in your embed code links. “Source: [Your Brand] Infographic on [Topic]” provides context while including relevant keywords naturally. Avoid exact-match keyword anchors that look manipulative.
Test embed codes across different platforms. WordPress, Squarespace, and other CMS platforms handle embedded content differently. Ensure your code works cleanly without breaking layouts.
Offer multiple embed size options. Some publishers want full-width graphics. Others need smaller versions for sidebars. Providing choices increases adoption.
Tracking and Measuring Campaign Performance
Establish baseline metrics before launching campaigns. Document your current backlink count, domain authority, organic traffic, and rankings for target keywords. Without baselines, you can’t measure improvement.
Use backlink monitoring tools to track new links. Ahrefs, Semrush, and Moz all offer alerts when new backlinks appear. Monitor both the quantity and quality of incoming links.
Track referral traffic from infographic placements. Google Analytics shows which external sites send visitors. High-traffic referrals indicate successful placements worth replicating.
Measure social shares and engagement. Tools like BuzzSumo track how content performs across social platforms. Share counts indicate resonance with audiences.
Calculate cost per link for ROI analysis. Divide total campaign costs (design, research, outreach time) by links acquired. Compare this metric across campaigns to identify what works best.
Monitor ranking changes for target keywords. Infographic link building should improve positions over time. If rankings don’t move despite link acquisition, investigate content quality or technical issues.
Avoiding Common Infographic Link Building Mistakes
Don’t create infographics without validating demand. Research before design prevents wasted resources on topics nobody cares about. Validate with keyword data and competitor analysis.
Avoid design-by-committee disasters. Too many stakeholders dilute creative vision. Establish clear decision-making authority before starting design work.
Don’t neglect mobile optimization. Many users view infographics on phones. Text that’s readable on desktop may be illegible on mobile. Test across devices.
Avoid outdated statistics. Nothing undermines credibility faster than citing data from five years ago. Use current sources and update infographics annually if they contain time-sensitive information.
Don’t spam outreach lists. Sending identical pitches to hundreds of contacts damages your reputation. Publishers talk to each other. Word spreads about lazy outreach.
Avoid link schemes disguised as infographic marketing. Paying for placements, excessive reciprocal linking, or using private blog networks violates Google’s guidelines. Stick to earning links through genuine value.
How long does infographic link building take?
Expect 4-8 weeks from concept to first links. Research and design require 2-3 weeks. Outreach campaigns typically generate initial responses within 2-4 weeks. Momentum builds over 3-6 months as organic discovery supplements active promotion.
How much does infographic link building cost?
Costs vary significantly based on approach. DIY campaigns using free design tools might cost only time investment. Professional infographic design ranges from $500-$3,000 depending on complexity. Full-service agency campaigns including research, design, and outreach typically run $2,000-$10,000 per infographic.
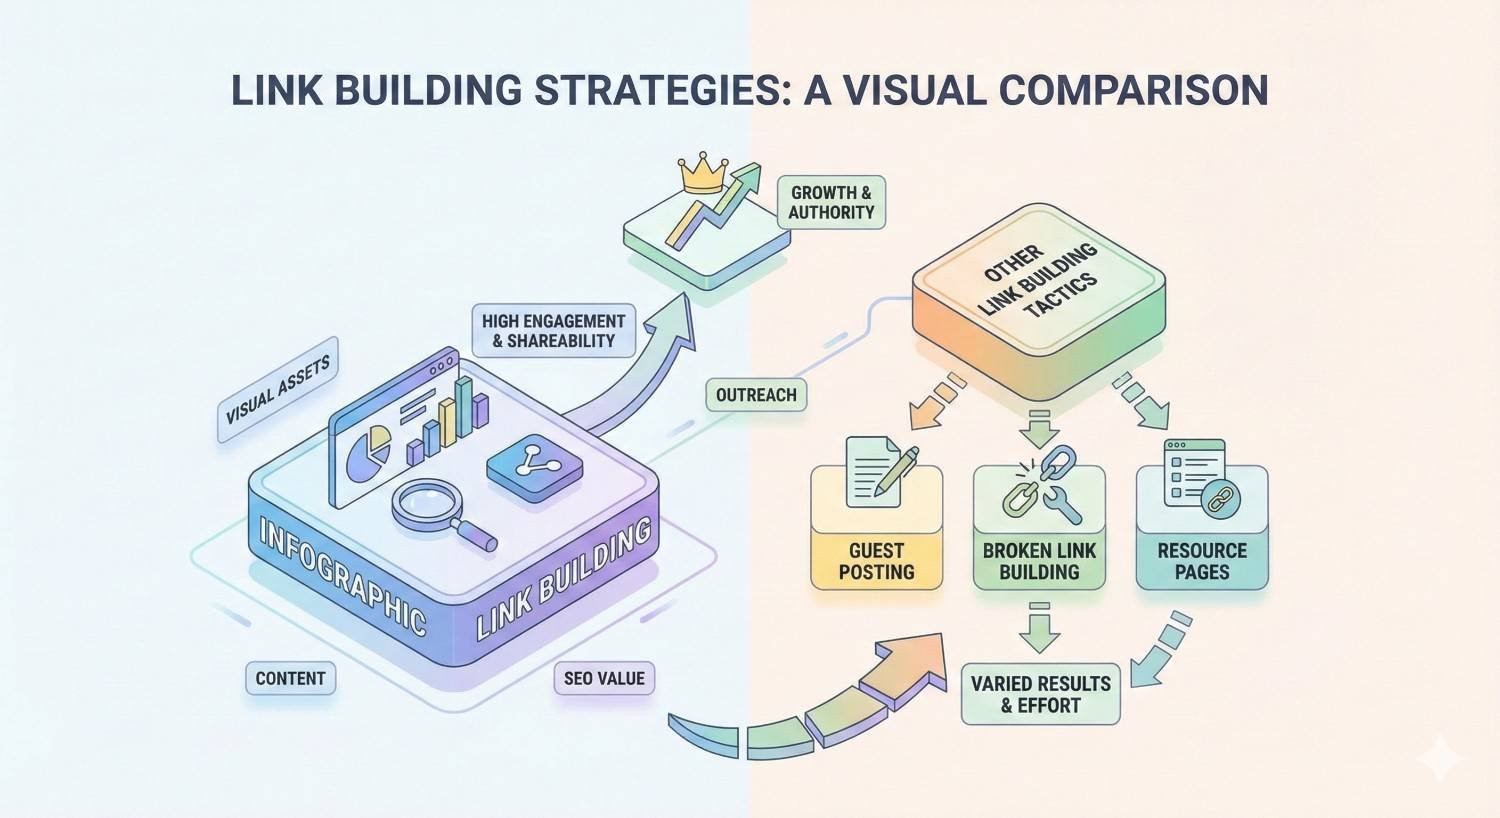
Infographic Link Building vs. Other Link Building Tactics
Understanding how infographic link building compares to alternatives helps you allocate resources effectively. Each tactic has strengths and limitations. The best strategies combine multiple approaches.
No single link building method works for every situation. Your industry, budget, timeline, and existing assets all influence which tactics make sense.
Infographics vs. Guest Posting
Guest posting requires ongoing content creation. Each placement demands a new article. Infographics scale differently. One graphic can earn dozens of links through multiple placements and organic discovery.
Guest posting offers more control over anchor text and placement context. You write the content, so you determine how links appear. Infographic embeds rely on publishers to implement attribution correctly.
Time investment differs significantly. A quality guest post takes 8-15 hours to research, write, and edit. An infographic requires similar upfront investment but can generate links passively afterward.
Guest posts work better for building relationships with specific publications. The collaborative process creates connections that lead to future opportunities. Infographic outreach is more transactional.
Both tactics complement each other. Guest posts featuring your infographics combine the benefits of both approaches.
Infographics vs. Broken Link Building
Broken link building identifies dead links on other websites and offers your content as a replacement. It’s highly targeted but labor-intensive.
Infographic link building creates new linking opportunities. Broken link building capitalizes on existing ones. The approaches serve different purposes in a comprehensive strategy.
Success rates differ. Broken link building conversion rates typically range from 5-15% of outreach emails. Infographic pitches to relevant publishers often achieve higher response rates because you’re offering something new rather than pointing out problems.
Broken link building requires extensive prospecting to find opportunities. Infographic outreach targets any relevant publisher regardless of their current link status. The prospect pool is larger.
Broken link building works well for competitive keywords where existing resources have aged out. Infographics excel when you have unique data or perspectives to share.
When to Use Infographic Link Building
Choose infographic link building when you have data worth visualizing. Statistics, processes, comparisons, and timelines all translate well to visual formats. If your topic doesn’t benefit from visualization, other tactics may work better.
Infographics make sense when you’re targeting multiple publications simultaneously. The scalability advantage shines when many websites cover your topic and could benefit from your visual asset.
Consider infographics when you want lasting link-building assets. Unlike guest posts that generate one link each, infographics continue earning links organically for years.
Avoid infographics when speed is critical. The design and production timeline doesn’t suit urgent campaigns. Guest posting or digital PR may deliver faster results.
Skip infographics if your budget is extremely limited. Quality design requires investment. Poorly designed infographics rarely earn links and can damage brand perception.
Infographic Link Building Tools and Resources
The right tools streamline every phase of infographic link building. From design to outreach to tracking, software solutions save time and improve results.
You don’t need every tool on this list. Start with essentials and add specialized solutions as your campaigns mature.
Design Tools for Creating Infographics
Canva offers accessible infographic templates suitable for beginners. The free tier provides enough functionality for basic graphics. Pro features unlock additional templates and brand kit management.
Piktochart specializes in infographic creation with data visualization features. The platform excels at turning spreadsheets into charts and graphs automatically.
Venngage provides extensive template libraries organized by industry and use case. The tool includes collaboration features useful for team-based design workflows.
Adobe Illustrator remains the professional standard for custom infographic design. The learning curve is steep, but capabilities are unmatched. Most agencies use Illustrator for client work.
Figma offers collaborative design capabilities with a gentler learning curve than Illustrator. The free tier supports individual creators, while team features require paid plans.
Outreach and Prospecting Tools
Ahrefs Content Explorer finds websites that have published or linked to similar infographics. The tool reveals outreach targets based on actual linking behavior.
Hunter.io locates email addresses for specific domains and individuals. The Chrome extension makes finding contacts while browsing efficient.
BuzzStream manages outreach campaigns at scale. The platform tracks conversations, schedules follow-ups, and measures response rates across campaigns.
Pitchbox automates prospecting and outreach workflows. The tool integrates with SEO platforms to identify link opportunities and manage communications.
LinkedIn Sales Navigator helps identify decision-makers at target publications. The advanced search filters locate content managers, editors, and writers by company and role.
Analytics and Backlink Tracking Tools
Google Search Console provides free backlink data directly from Google. While not comprehensive, it shows which links Google has discovered and indexed.
Ahrefs offers the most comprehensive backlink database. The tool tracks new and lost links, analyzes competitor backlink profiles, and monitors domain authority changes.
Semrush combines backlink tracking with broader SEO analytics. The platform’s link building toolkit includes outreach management alongside monitoring.
Moz Link Explorer provides domain authority metrics and backlink analysis. The spam score feature helps evaluate link quality.
Google Analytics tracks referral traffic from infographic placements. Custom UTM parameters help attribute conversions to specific campaigns.
Infographic Link Building Case Studies and Examples
Real-world examples illustrate what works and what doesn’t. Learning from others’ successes and failures accelerates your own results.
These case studies demonstrate principles applicable across industries. The specific tactics may vary, but underlying strategies remain consistent.
Successful Infographic Campaigns
Moz’s Google Algorithm Update History infographic became a definitive industry resource. The visual timeline of algorithm changes earned thousands of backlinks because it solved a genuine information need. Publishers covering SEO topics linked to it as a reference.
The success factors: original research compilation, ongoing updates to maintain relevance, and targeting a topic with sustained search interest. Moz continues updating the resource, generating new links with each revision.
Venngage’s “What Makes a Good Infographic” meta-infographic earned links by teaching the very skill it demonstrated. The self-referential approach attracted attention from design blogs, marketing publications, and educational resources.
Key insight: infographics about infographic creation have built-in audiences among content creators who might link to helpful resources.
HubSpot’s marketing statistics infographics consistently perform well because they aggregate data marketers need. Each annual update generates fresh outreach opportunities and organic links from writers citing current statistics.
The pattern: recurring content tied to annual cycles creates predictable link-building opportunities.
Lessons Learned from Failed Campaigns
Infographics fail when they prioritize design over substance. Beautiful graphics with shallow data don’t earn links. Publishers need genuinely useful information, not just pretty pictures.
Overly promotional infographics underperform. Graphics that read like advertisements rather than educational content get rejected by publishers. Keep branding subtle and focus on value.
Poor timing kills otherwise good infographics. Launching a “2024 Trends” infographic in November 2024 misses the window. Publishers want forward-looking content at year’s start, not year’s end.
Neglecting outreach dooms many campaigns. Teams invest heavily in design, then expect organic discovery alone. Without proactive promotion, even excellent infographics languish in obscurity.
Targeting oversaturated topics limits results. If dozens of infographics already cover your subject, differentiation becomes difficult. Find unique angles or underserved subtopics.
How to Get Started with Infographic Link Building
Starting your first infographic link building campaign doesn’t require massive budgets or specialized expertise. A systematic approach produces results even for beginners.
Choose your path based on available resources. DIY approaches work for teams with time but limited budgets. Agency partnerships suit organizations prioritizing speed and scale.
DIY Infographic Link Building Steps
Step 1: Topic Research (Week 1) Identify 3-5 potential topics using keyword research and competitor analysis. Validate demand by checking search volume and existing infographic competition. Select the topic with the best combination of interest and opportunity.
Step 2: Data Collection (Week 1-2) Gather statistics, research findings, and expert insights for your chosen topic. Document sources meticulously. Aim for 15-25 data points to provide comprehensive coverage.
Step 3: Outline and Copy (Week 2) Structure your infographic with clear sections and logical flow. Write all text content including headlines, statistics, and source citations. Get stakeholder approval before design begins.
Step 4: Design (Week 2-3) Create the infographic using your chosen design tool. Follow brand guidelines while prioritizing readability. Test across devices and gather feedback before finalizing.
Step 5: Landing Page Creation (Week 3) Build a dedicated page with supporting content, embed code, and social sharing options. Optimize for search with proper meta tags, alt text, and schema markup.
Step 6: Outreach Campaign (Week 4+) Build your prospect list, craft personalized pitches, and begin outreach. Track responses and follow up appropriately. Continue outreach for 4-6 weeks while monitoring results.
Hiring an Agency for Infographic Link Building
Agencies bring expertise, established processes, and existing publisher relationships. These advantages accelerate results compared to learning through trial and error.
Evaluate agencies based on portfolio quality and documented results. Ask for case studies showing actual links earned, not just infographics created. Design capability without link building success indicates incomplete service.
Understand pricing models before committing. Some agencies charge per infographic. Others offer monthly retainers covering multiple assets. Performance-based pricing ties costs to links delivered.
Clarify deliverables and timelines upfront. What’s included in design revisions? Who handles outreach? What reporting will you receive? Ambiguity leads to disappointment.
Request references from current or recent clients. Speaking with other customers reveals working style, communication quality, and actual results versus promises.
Set realistic expectations. Even excellent agencies can’t guarantee specific link counts. They can commit to quality processes and reasonable projections based on experience.
Frequently Asked Questions About Infographic Link Building
Is infographic link building still effective?
Yes, infographic link building remains effective in 2025. Visual content continues earning editorial backlinks because publishers need engaging assets. The tactic has evolved, requiring higher quality and more strategic outreach than in earlier years, but fundamentals still work.
How many backlinks can you get from one infographic?
Results vary dramatically based on topic, quality, and promotion effort. A well-executed campaign typically earns 10-50 backlinks within the first six months. Exceptional infographics on high-interest topics can generate 100+ links over their lifetime.
What makes an infographic go viral?
Viral infographics combine surprising data, emotional resonance, and exceptional design. They present information people want to share because it makes them look informed or helpful. Timing, influencer amplification, and platform-specific optimization also contribute to viral spread.
How do you measure infographic link building ROI?
Calculate ROI by comparing campaign costs against value delivered. Track backlinks earned, referral traffic generated, and ranking improvements for target keywords. Assign monetary value to these outcomes based on equivalent paid acquisition costs or revenue attribution.
Conclusion
Infographic link building combines creative content development with strategic outreach to earn high-quality backlinks that improve search visibility and domain authority. The approach works because it provides genuine value to publishers while building your brand’s reputation as an industry resource.
Success requires commitment to quality at every stage. Research validates topics worth pursuing. Professional design ensures shareability. Strategic outreach connects your content with relevant publishers. Ongoing measurement guides optimization.
We help businesses build sustainable organic growth through proven link building strategies, including infographic campaigns tailored to your industry and goals. Contact White Label SEO Service to discuss how infographic link building fits into your broader SEO strategy and start earning the authoritative backlinks your site deserves.
Frequently Asked Questions
What industries benefit most from infographic link building?
Data-rich industries like finance, healthcare, technology, and marketing see strong results because they have statistics worth visualizing. However, any industry with complex information that benefits from visual explanation can succeed with infographic link building.
How often should you publish new infographics?
Quality matters more than frequency. Most successful programs publish 1-2 infographics monthly, allowing adequate time for research, design, and promotion. Rushing production to meet arbitrary quotas typically reduces quality and results.
Can infographic link building hurt your SEO?
Only if executed poorly. Low-quality infographics on spammy sites, manipulative anchor text, or paid placements disguised as editorial links can trigger penalties. Legitimate infographic link building following white-hat practices poses no risk.
Do infographic links pass the same value as text links?
Yes, properly attributed infographic embeds pass link equity like any other editorial backlink. The key is ensuring embed codes include dofollow links with appropriate anchor text. Image-only embeds without attribution links provide no SEO value.
How do you update outdated infographics?
Refresh statistics with current data, update design elements if needed, and republish with a new date. Notify previous linkers about the update, giving them reason to re-share. Updated infographics often earn additional links from the refresh announcement alone.
What’s the ideal infographic length?
Most successful infographics contain 1,500-3,000 pixels in height, presenting 8-15 distinct data points. Longer infographics risk losing viewer attention. Shorter ones may lack sufficient depth to justify embedding. Match length to topic complexity.
Should you gate infographics behind email capture?
Generally no. Gating reduces sharing and linking because publishers can’t easily embed restricted content. If lead generation is a priority, offer ungated versions for embedding while providing downloadable high-resolution versions in exchange for email addresses.


