
Original data is one of the most powerful link-building assets you can create. When you publish unique statistics, journalists, bloggers, and content creators cite your research—earning you high-authority backlinks without aggressive outreach.
Statistics-based link building transforms your brand into a primary source that others reference naturally. This approach builds sustainable authority while competitors chase temporary tactics.
This guide covers the complete process: creating link-worthy statistics, publishing for maximum visibility, outreach strategies, and measuring ROI on your data investments.
What Is Statistics-Based Link Building?
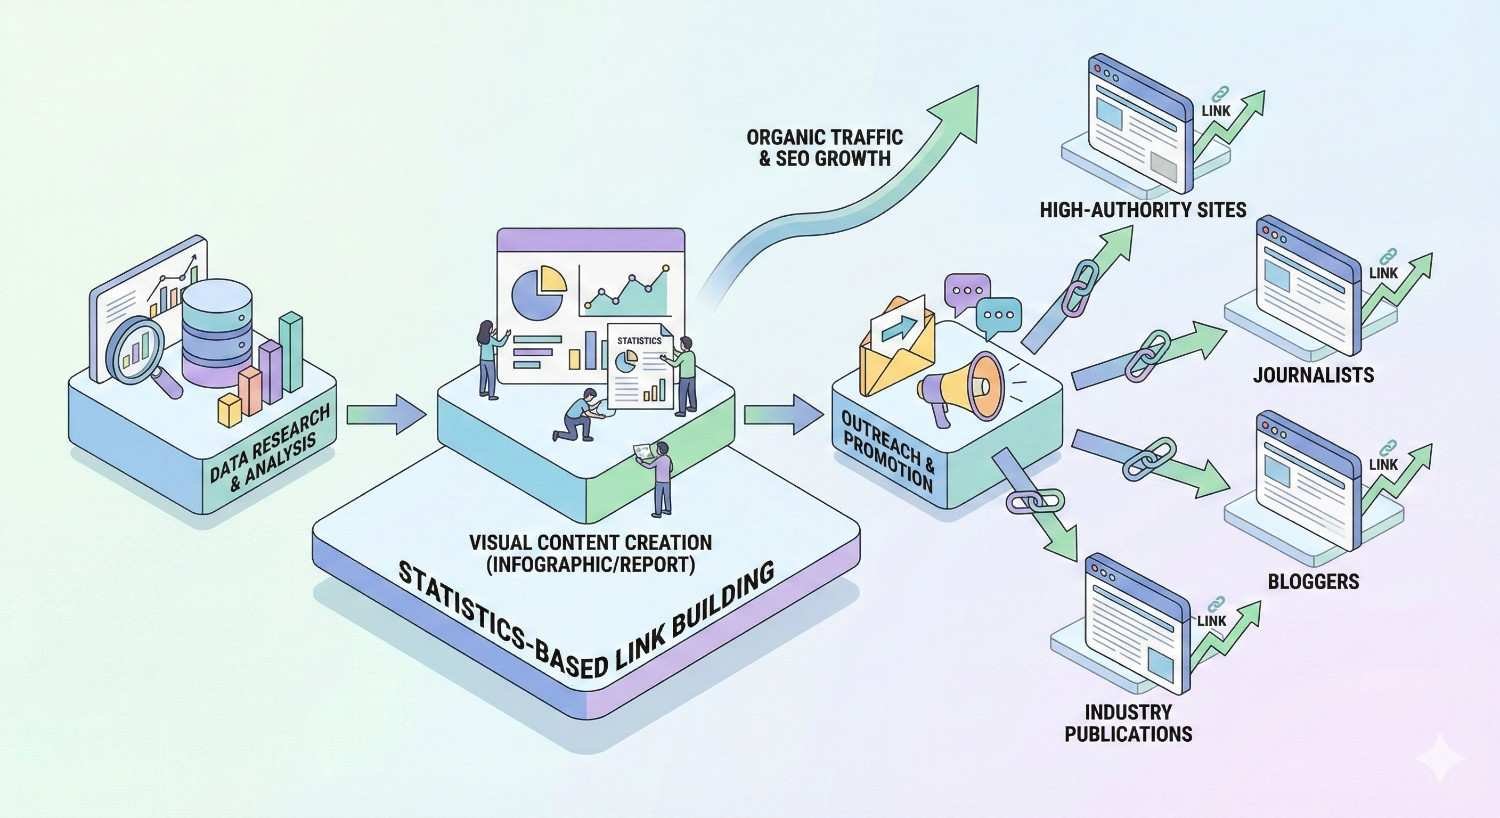
Statistics-based link building is a content strategy where you create and publish original data, research findings, or unique statistics that other websites cite and link to as authoritative sources. Instead of requesting links through traditional outreach, you produce valuable data assets that naturally attract citations from journalists, bloggers, researchers, and content creators who need credible statistics to support their own content.
This approach positions your brand as a primary source rather than a secondary commentator. When your data becomes the go-to reference for industry statistics, backlinks accumulate organically over time—often from high-authority publications that would never respond to standard link requests.
How Statistics-Based Link Building Works
The process begins with identifying information gaps in your industry. What questions do people ask that lack definitive answers? What data points do content creators struggle to find? Once you identify these gaps, you collect data through surveys, internal analysis, or aggregation methods.
After gathering statistically valid data, you extract newsworthy insights and publish them in formats optimized for citation. This includes dedicated statistics pages, research reports, and embeddable visual assets. The final step involves strategic promotion to journalists and content creators who actively need data for their work.
The link acquisition happens when writers discover your statistics through search, outreach, or industry channels. They cite your data in their articles, creating backlinks that signal authority to search engines. Unlike guest posts or directory submissions, these links come from genuine editorial decisions—the exact type of backlinks Google values most.
Why Original Data Attracts Backlinks
Content creators face a persistent challenge: they need credible statistics to support their arguments, but finding reliable, current data is difficult. Most statistics pages simply aggregate data from other sources, creating a citation chain that leads back to a handful of original studies.
When you publish original research, you become the primary source. Writers prefer citing primary sources because it strengthens their credibility. A journalist writing about marketing trends would rather cite your original survey of 500 marketers than reference another article that cited another article that eventually traced back to some study.
Original data also provides exclusivity. If you’re the only source for a specific statistic, every article discussing that topic must link to you. This creates a competitive moat that compounds over time as more content references your research.
Statistics-Based Link Building vs. Traditional Outreach
Traditional link building relies on convincing website owners to add links to existing content. You identify prospects, craft personalized emails, and hope recipients find enough value to modify their pages. Response rates typically hover in single digits, and the process requires constant effort to maintain link velocity.
Statistics-based link building inverts this dynamic. Instead of asking for links, you create assets that others want to link to. The initial investment in data creation is higher, but the ongoing effort decreases as your statistics gain visibility. A single well-researched study can generate links for years without additional outreach.
The quality difference matters too. Links from traditional outreach often come from sites willing to add links—not necessarily the most authoritative sources. Statistics-based links come from sites that genuinely need your data, including major publications, industry leaders, and academic resources that would never accept a standard link request.
Types of Statistics That Earn Backlinks
Not all statistics attract equal attention. The most link-worthy data fills genuine information gaps, provides actionable insights, or challenges conventional assumptions. Understanding which types of statistics perform best helps you prioritize your research investments.
Industry Benchmark Data
Benchmark statistics answer the question “how does my performance compare?” Marketers want to know average email open rates. Sales teams need typical conversion benchmarks. Operations managers seek industry-standard efficiency metrics.
Benchmark data earns links because it provides context for individual performance. When someone writes about improving email marketing, they need a baseline to establish what “good” looks like. Your benchmark study becomes the reference point for countless articles discussing performance optimization.
The key to effective benchmark data is specificity. Generic benchmarks exist everywhere. Benchmarks segmented by industry, company size, geography, or use case fill gaps that broad studies miss. A benchmark for “B2B SaaS email open rates for companies with 50-200 employees” serves a specific audience that generic email statistics ignore.
Survey and Research Statistics
Survey-based research captures opinions, behaviors, and trends directly from your target audience. This data type works particularly well for topics where official statistics don’t exist or where you need current sentiment rather than historical data.
Effective survey research requires careful methodology. Sample size matters—most credible surveys include at least 300-500 respondents for statistical significance. Question design affects data quality; leading questions or confusing phrasing undermines credibility.
The most linkable survey statistics reveal surprising findings or quantify previously unmeasured phenomena. “Most marketers use social media” isn’t newsworthy. “67% of B2B marketers say LinkedIn generates more qualified leads than all other platforms combined” provides a specific, quotable insight that writers want to reference.
Case Study Performance Metrics
Case studies document real results from specific implementations. While individual case studies have limited statistical validity, aggregated case study data provides powerful evidence for what works in practice.
The link-building value comes from specificity and credibility. Abstract claims about “improved performance” don’t attract citations. Documented results showing “340% increase in organic traffic over 12 months using this specific approach” give writers concrete numbers to reference.
Case study metrics work best when you can aggregate multiple examples. A single case study might be an outlier. Ten case studies showing similar patterns suggest a reliable trend. This aggregation transforms anecdotal evidence into statistical evidence.
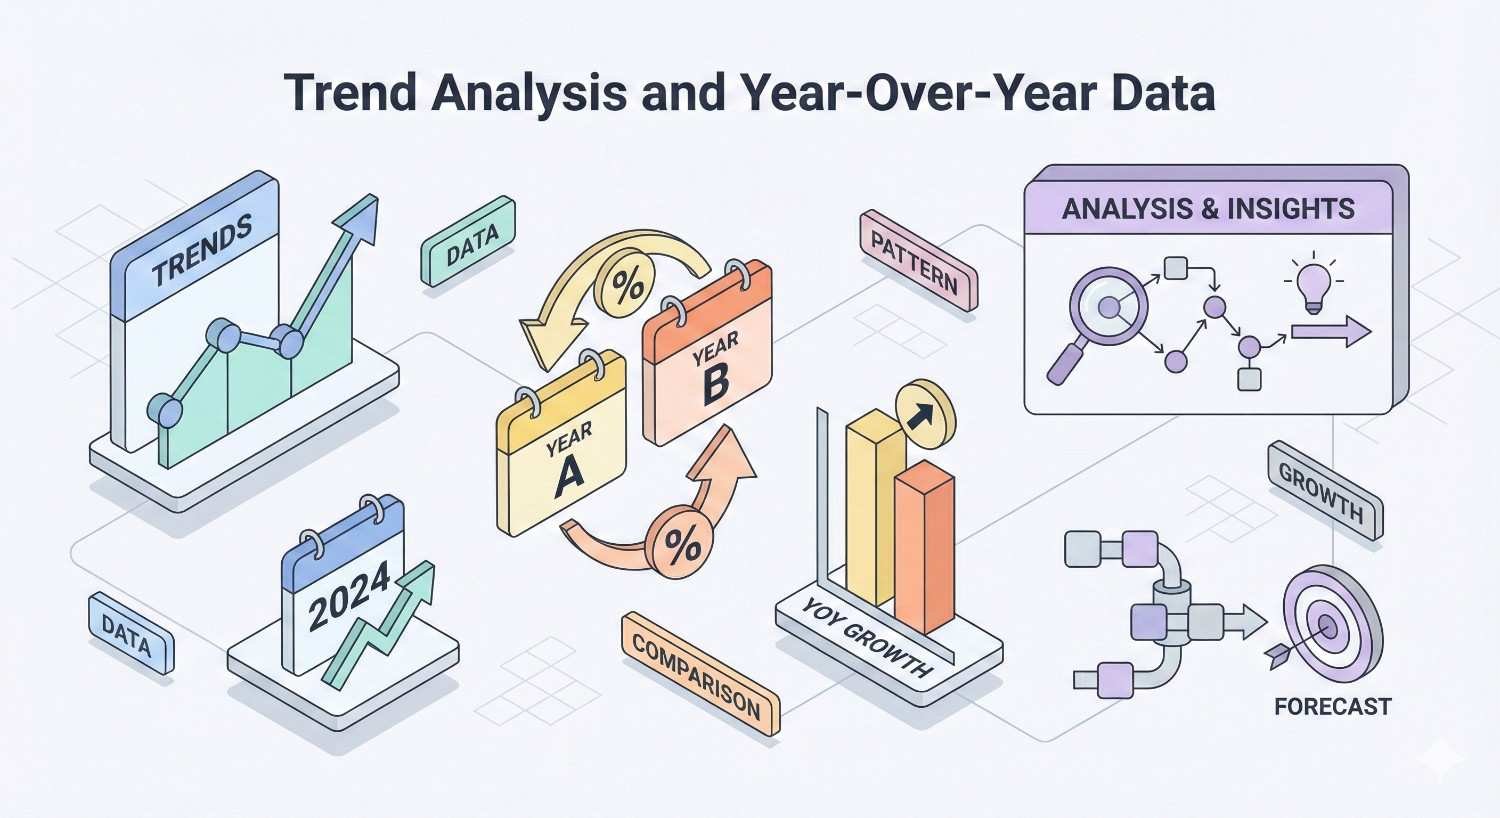
Trend Analysis and Year-Over-Year Data
Trend data tracks changes over time, revealing patterns that single-point measurements miss. This type of statistics becomes increasingly valuable as you build longitudinal datasets that competitors can’t quickly replicate.
Annual trend reports create recurring link opportunities. Each year’s update generates fresh content that references previous years’ data while providing new insights. Writers covering industry developments naturally cite trend data to establish context and direction.
The compounding effect of trend data creates significant competitive advantages. After three years of consistent measurement, you own a dataset that would take competitors three years to replicate. This temporal moat protects your position as the authoritative source.
Aggregated Customer or User Data
If your business generates user data, you’re sitting on a potential goldmine of link-worthy statistics. Aggregated and anonymized customer data provides insights that external researchers simply cannot access.
E-commerce platforms can report on purchasing trends. Software companies can share usage patterns. Service providers can document outcome metrics. This proprietary data creates exclusive statistics that only you can publish.
The key consideration is privacy and anonymization. Aggregated data should never expose individual users or customers. Focus on patterns and trends rather than specific behaviors. When done correctly, this data type provides unique value while respecting user privacy.
How to Create Link-Worthy Statistics (Step-by-Step Process)
Creating statistics that earn backlinks requires systematic methodology. Random data collection rarely produces link-worthy results. This process ensures your research investment generates maximum return.
Step 1: Identify Data Gaps in Your Industry
Start by researching what statistics already exist and where gaps remain. Search for common questions in your industry and note which ones lack definitive data-backed answers.
Review competitor content to identify statistics they cite. Trace those citations back to original sources. Note the publication dates—outdated statistics represent opportunities for fresh research. Check whether existing data covers your specific niche or only addresses broader categories.
Use keyword research tools to find question-based queries with significant search volume but limited authoritative answers. These queries indicate demand for data that doesn’t currently exist in accessible form.
Talk to your sales and customer success teams. What questions do prospects ask that you can’t answer with existing data? These real-world information gaps often translate into link-worthy research opportunities.
Step 2: Choose Your Data Collection Method
Your data collection method depends on the type of statistics you’re creating, available resources, and desired credibility level. Each approach has distinct advantages and limitations.
Primary Research (Surveys, Studies, Experiments)
Primary research involves collecting new data directly from sources. Surveys gather opinions and self-reported behaviors. Studies observe and measure phenomena. Experiments test hypotheses under controlled conditions.
Surveys offer the most accessible primary research method for most businesses. Online survey tools make distribution straightforward, and panel services provide access to specific demographics. The investment scales with sample size and targeting requirements.
Studies and experiments require more resources but produce higher-credibility data. A/B tests, observational studies, and controlled experiments provide evidence that survey data cannot match. Consider these methods for high-stakes research where credibility justifies the investment.
Internal Data Analysis
Your existing business data may contain valuable statistics waiting to be extracted. Customer databases, transaction records, usage logs, and performance metrics all represent potential research material.
Internal data analysis requires careful anonymization and aggregation. Individual customer information must remain private. Focus on patterns across your user base rather than specific behaviors. Ensure your data use complies with privacy policies and regulations.
The advantage of internal data is exclusivity. Competitors cannot access your proprietary information. This creates statistics that only you can publish, establishing permanent ownership of specific data points.
Data Aggregation and Meta-Analysis
Data aggregation compiles existing statistics from multiple sources into comprehensive resources. Meta-analysis applies statistical methods to combine findings from multiple studies.
This approach works well when original research isn’t feasible but scattered data exists across many sources. By collecting, organizing, and synthesizing existing statistics, you create value through curation rather than original collection.
The link-building potential depends on execution quality. Simple lists of statistics from other sources provide limited value. Thoughtful analysis that identifies patterns, resolves contradictions, and provides context transforms aggregation into genuine insight.
Step 3: Ensure Statistical Validity and Sample Size
Credibility determines whether your statistics earn links from authoritative sources. Flawed methodology undermines the entire investment, regardless of how interesting your findings appear.
Sample size requirements depend on your research goals and population characteristics. For survey research, 300-500 respondents typically provides acceptable confidence levels for most business applications. Smaller samples work for narrow populations; larger samples enable more granular segmentation.
Consider margin of error and confidence intervals. A survey of 400 respondents typically yields a margin of error around ±5% at 95% confidence. Understand what these numbers mean and communicate them transparently in your research.
Sampling methodology affects validity as much as sample size. Random sampling produces more reliable results than convenience sampling. Panel quality matters—cheap survey panels often include inattentive or fraudulent respondents who compromise data quality.
Document your methodology thoroughly. Credible publications will evaluate your research methods before citing your statistics. Transparent methodology builds trust and increases citation likelihood.
Step 4: Analyze and Extract Newsworthy Insights
Raw data doesn’t earn links—insights do. The analysis phase transforms numbers into stories that writers want to tell.
Look for surprising findings that challenge assumptions. Data confirming what everyone already believes rarely generates interest. Statistics revealing unexpected patterns or contradicting conventional wisdom create news value.
Identify specific, quotable numbers. Vague findings like “most respondents agreed” don’t work as citations. Precise statistics like “73% of respondents strongly agreed” give writers concrete data points to reference.
Segment your data to find niche insights. Overall averages often hide interesting variations. Breaking down results by industry, company size, role, or other relevant factors reveals specific statistics that serve targeted audiences.
Consider the narrative potential. What story does your data tell? Statistics that support compelling narratives earn more links than isolated numbers without context.
Step 5: Format Statistics for Maximum Shareability
How you present statistics affects their citation potential. Optimized formatting makes your data easy to find, understand, and reference.
Create clear, concise stat statements. Each key finding should be expressible in a single sentence that writers can quote directly. Avoid burying important numbers in complex paragraphs.
Use consistent formatting for numbers. Percentages, dollar amounts, and other metrics should follow standard conventions. Round appropriately—73.2% is usually better than 73.247% for readability.
Provide context for every statistic. Raw numbers without context confuse readers. Include comparison points, time frames, and scope definitions that help writers understand and accurately represent your data.
Make statistics scannable. Use bullet points, tables, and highlighted callouts to help readers quickly find specific data points. Writers scanning for statistics won’t read every paragraph—make key numbers visually prominent.
Step 6: Create Supporting Visual Assets
Visual representations of data increase shareability and provide additional link opportunities. Charts, graphs, and infographics make statistics more engaging and easier to understand.
Design charts that communicate clearly. Avoid cluttered visualizations that obscure the data. Each visual should convey one primary insight that viewers grasp immediately.
Create embeddable assets with attribution. Infographics and charts that other sites can embed—with built-in links back to your source—generate passive link acquisition. Make embedding easy with provided code snippets.
Optimize visuals for different platforms. Social media requires different dimensions than blog posts. Create multiple versions of key visuals to maximize distribution potential across channels.
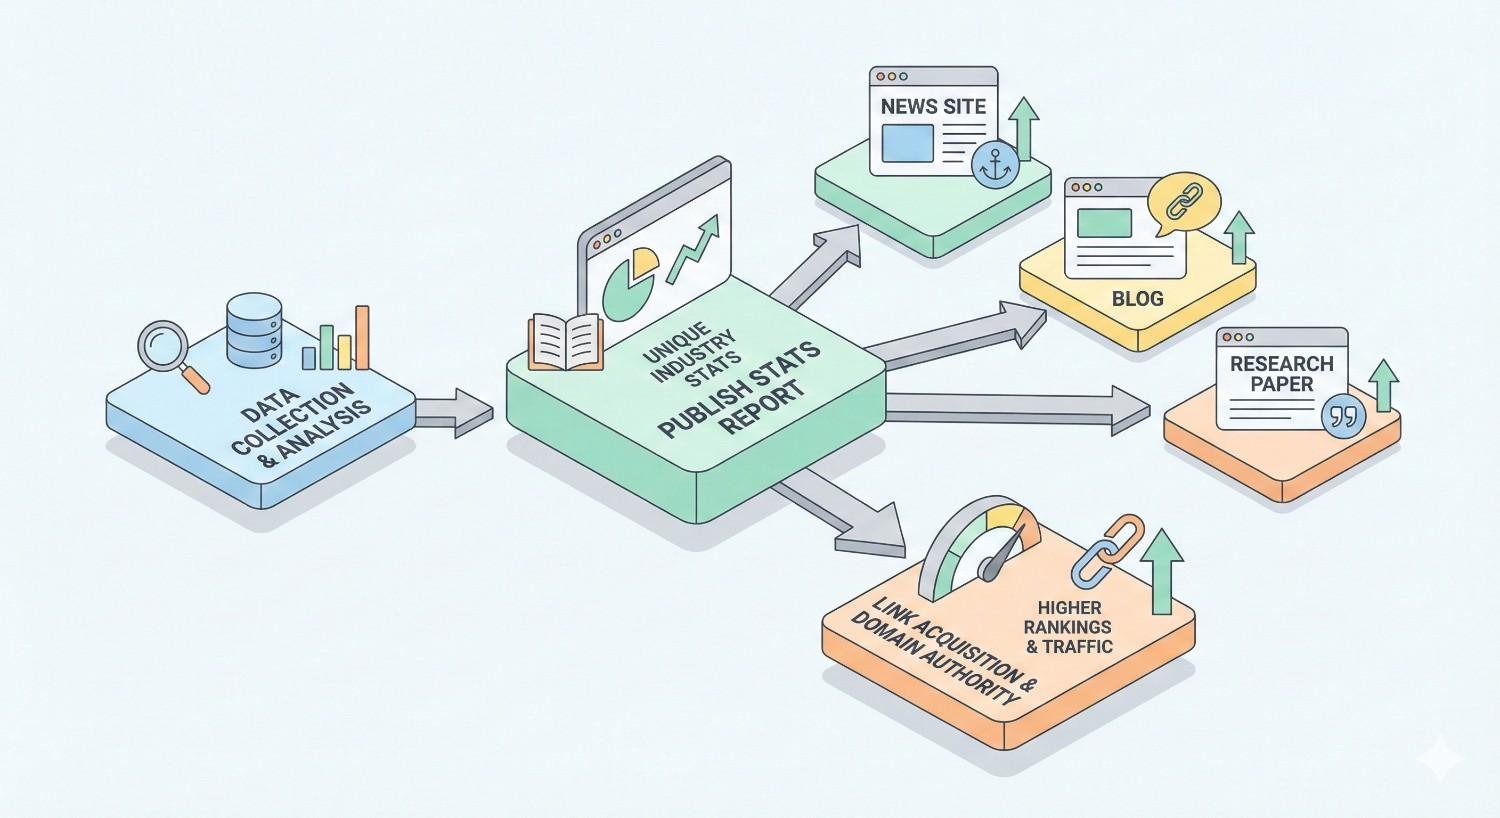
Publishing Your Statistics for Link Acquisition
Where and how you publish statistics significantly impacts their link-building performance. Strategic publication maximizes visibility and citation potential.
Creating a Dedicated Statistics Page
A central statistics page serves as the primary citation target for your research. This page should be optimized for searches like “[industry] statistics” and “[topic] data.”
Structure the page for easy scanning. Use clear headings, bullet points, and visual hierarchy to help visitors quickly find specific statistics. Writers searching for data don’t want to read lengthy narratives—they want numbers.
Include publication dates and update schedules. Fresh data earns more links than stale statistics. Clearly communicate when data was collected and when you plan to update it.
Optimize for featured snippets. Format key statistics in ways that Google can easily extract for search results. This increases visibility and drives traffic from people searching for specific data points.
Writing Data-Driven Blog Posts and Reports
Blog posts and reports provide context and narrative around your statistics. While the statistics page serves quick-reference needs, longer content explores implications and applications.
Structure posts around key findings. Each major insight can support a dedicated article that explores the data in depth. This creates multiple content pieces from a single research investment.
Include methodology sections. Detailed methodology information builds credibility and helps readers evaluate your research quality. Place this information where interested readers can find it without disrupting the main narrative.
Link internally to your statistics page. Blog posts should drive traffic to your central statistics resource, concentrating link equity and establishing the statistics page as the primary citation target.
Designing Embeddable Infographics and Charts
Embeddable visual assets generate links passively. When other sites embed your infographics, they typically include attribution links back to your source.
Design with embedding in mind. Create visuals that work well on other sites—appropriate dimensions, readable text at various sizes, and clear branding that identifies the source.
Provide embed codes. Make embedding effortless by offering copy-paste code snippets. Include the attribution link in the embed code so it’s automatically included when sites use your visual.
Track embed usage. Monitor where your visuals appear and follow up on unlinked embeds. Some sites will use your graphics without proper attribution—polite outreach often converts these into linked citations.
Optimizing for Citation and Attribution
Make citing your statistics as easy as possible. Friction in the citation process reduces link acquisition.
Provide suggested citation formats. Show writers exactly how to reference your data, including the link they should use. This removes guesswork and increases proper attribution.
Use clear, linkable URLs. Your statistics page URL should be short, descriptive, and permanent. Avoid URLs with dates or parameters that might change.
Include share buttons with pre-written text. Social sharing buttons that include key statistics and links make it easy for readers to spread your data across their networks.
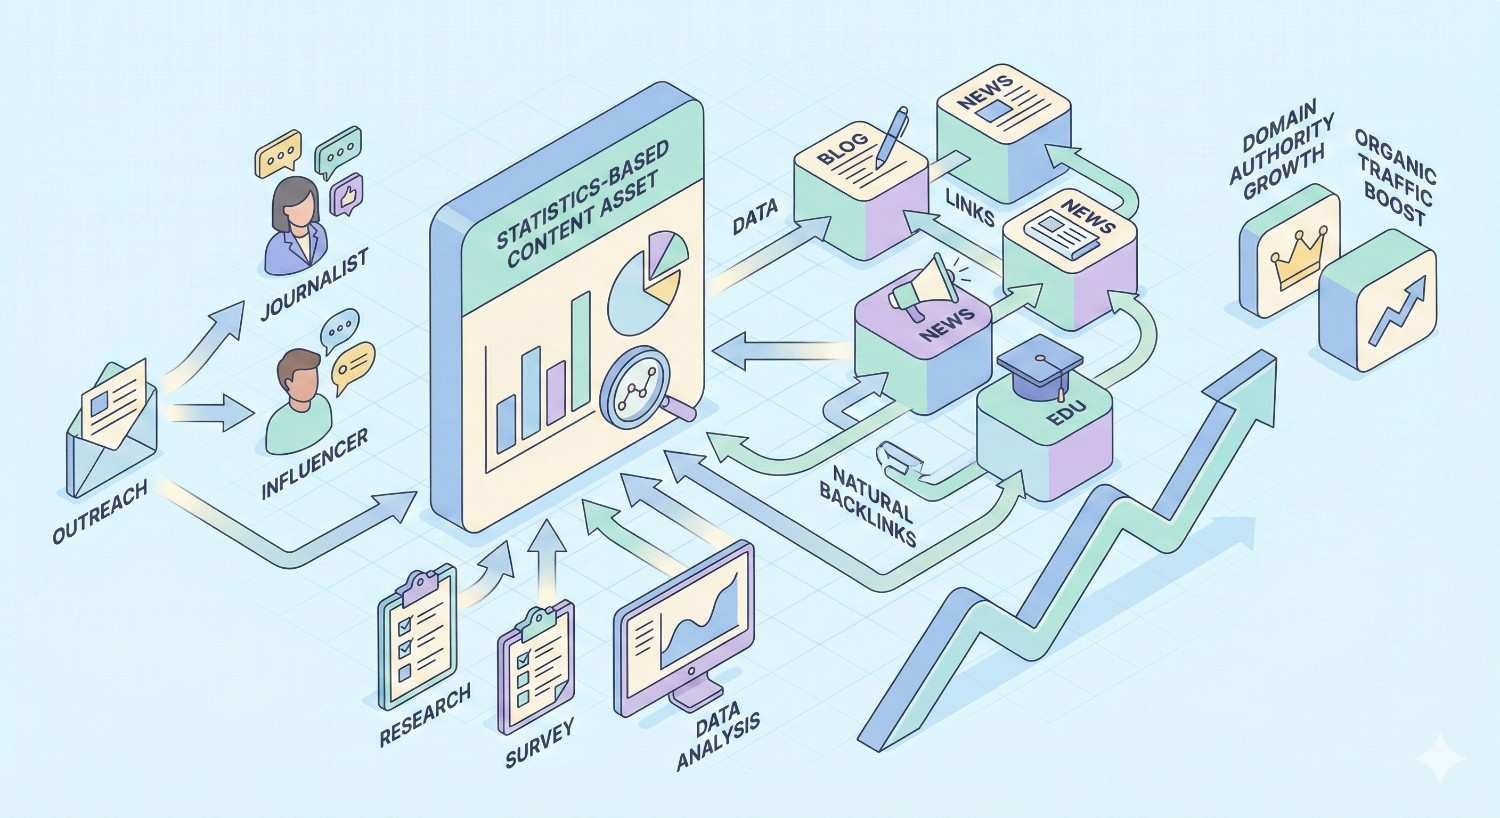
Outreach Strategies for Statistics-Based Link Building
While statistics-based link building generates organic links, strategic outreach accelerates results. Proactive promotion puts your data in front of people who need it.
Identifying Journalists and Content Creators Who Need Data
Not everyone needs statistics. Focus outreach on writers who regularly cite data in their work.
Search for articles in your industry that cite statistics. The writers who created those articles are proven data users. They’ve demonstrated willingness to cite external sources and likely need fresh data for future pieces.
Monitor industry publications for data-heavy content. Publications that regularly feature statistics-driven articles represent ongoing opportunities. Build relationships with editors and writers at these outlets.
Use social listening to find people asking for data. Writers often tweet or post asking for statistics on specific topics. These real-time requests represent immediate opportunities to provide value.
Crafting Data-Focused Outreach Emails
Outreach for statistics differs from traditional link requests. You’re offering value rather than asking for favors.
Lead with the data, not the ask. Open emails with your most compelling statistic. If the data is genuinely valuable, the recipient will want to know more.
Explain why your data matters to their audience. Connect your statistics to topics they cover. Show that you understand their content and have something specifically relevant to offer.
Make the next step easy. Include direct links to your statistics page and offer to answer questions about methodology. Remove any friction between interest and citation.
Pitching to Industry Publications and News Sites
Major publications have higher standards but provide more valuable links. Tailor your approach to their editorial processes.
Study their content guidelines. Many publications have specific requirements for contributed content or data submissions. Following these guidelines increases acceptance likelihood.
Pitch newsworthy angles. Publications want stories, not just statistics. Frame your data around trends, implications, or surprising findings that create narrative interest.
Offer exclusive access. Some publications value exclusivity. Offering first access to your data before public release can secure coverage from outlets that wouldn’t otherwise respond.
Leveraging HARO and Source Request Platforms
Help A Reporter Out (HARO) and similar platforms connect journalists with sources. These services provide direct access to writers actively seeking data.
Monitor relevant categories daily. Journalist requests have short deadlines. Quick responses increase your chances of being selected as a source.
Respond with specific data. Journalists using these platforms need concrete information. Lead with relevant statistics from your research rather than general expertise claims.
Build relationships beyond single responses. Successful HARO responses can lead to ongoing relationships with journalists who return to you for future data needs.
Following Up on Unlinked Mentions
Sometimes writers cite your statistics without linking to your source. These unlinked mentions represent easy link opportunities.
Set up alerts for your brand and key statistics. Google Alerts, Mention, and similar tools notify you when your data appears online.
Reach out politely when you find unlinked citations. Most writers simply forgot to add the link or didn’t realize it was expected. A friendly email usually results in a quick addition.
Provide the exact URL to use. Make it easy for writers to add the link by including the specific page you want them to reference.
Measuring the Success of Statistics-Based Link Building
Tracking performance helps you understand ROI and optimize future research investments. Multiple metrics provide a complete picture of statistics-based link building success.
Tracking Backlink Acquisition from Statistics
Monitor new backlinks to your statistics pages using tools like Ahrefs, Moz, or Semrush. Track both quantity and quality of acquired links.
Segment links by source type. Links from major publications carry more weight than links from small blogs. Understanding your link profile composition helps evaluate true impact.
Track link velocity over time. Statistics-based content often shows increasing link acquisition as visibility grows. Declining velocity might indicate your data is becoming outdated.
Monitoring Citation Frequency and Referral Traffic
Beyond backlinks, track how often your statistics appear across the web. Citation frequency indicates influence even when links aren’t included.
Monitor referral traffic from linking sites. High-quality links should drive relevant traffic. If links aren’t generating visits, the linking sites may have limited audiences.
Track which specific statistics get cited most. This information guides future research priorities. Double down on data types that attract the most attention.
Measuring Domain Authority and Ranking Impact
Statistics-based links should improve your overall domain authority and keyword rankings. Track these metrics to understand broader SEO impact.
Monitor domain authority trends. Tools like Moz and Ahrefs provide domain authority scores that should increase as you acquire quality backlinks.
Track rankings for target keywords. Your statistics pages should rank for relevant data-related queries. Improving rankings indicate growing topical authority.
Calculating ROI on Data Production
Understanding the cost-effectiveness of statistics-based link building helps justify continued investment and optimize resource allocation.
Calculate cost per link. Divide total research investment by links acquired. Compare this to cost per link from other link-building methods.
Consider long-term value. Statistics-based links often continue accumulating for years. Factor ongoing link acquisition into ROI calculations rather than just initial results.
Account for secondary benefits. Brand awareness, thought leadership positioning, and content repurposing opportunities add value beyond direct link acquisition.
Tools and Resources for Statistics-Based Link Building
The right tools streamline research, publication, and promotion processes. This toolkit covers essential categories for statistics-based link building.
Survey and Data Collection Tools
Survey platforms enable primary research at scale. Options range from free tools for basic needs to enterprise solutions for complex research.
Google Forms provides free basic survey functionality. SurveyMonkey and Typeform offer more features and better user experience. For advanced needs, Qualtrics and SurveyGizmo provide sophisticated logic and analysis capabilities.
Panel services like Prolific, Respondent, and Cint provide access to specific demographics when you need targeted respondents beyond your existing audience.
Data Visualization and Infographic Platforms
Visual tools transform raw data into shareable assets. Choose based on your design capabilities and output requirements.
Canva offers accessible infographic creation for non-designers. Piktochart and Venngage specialize in data visualization with templates optimized for statistics presentation.
For advanced visualizations, Tableau and Google Data Studio provide powerful charting capabilities. These tools require more expertise but produce more sophisticated outputs.
Backlink Monitoring and Outreach Tools
Track link acquisition and manage outreach campaigns with specialized SEO tools.
Ahrefs, Moz, and Semrush all provide comprehensive backlink monitoring. Each offers slightly different features—many SEO professionals use multiple tools for complete coverage.
For outreach management, tools like BuzzStream, Pitchbox, and Hunter.io help organize campaigns, find contact information, and track responses.
Statistical Analysis Software
Proper analysis requires appropriate tools. Your choice depends on analysis complexity and technical expertise.
Excel and Google Sheets handle basic statistical analysis adequately for most business research. Built-in functions cover common calculations like averages, percentages, and basic significance testing.
For advanced analysis, R and Python provide powerful statistical capabilities. SPSS and Stata offer user-friendly interfaces for complex statistical methods without coding requirements.
Common Mistakes to Avoid in Statistics-Based Link Building
Understanding common pitfalls helps you avoid wasted investment and credibility damage. These mistakes undermine even well-intentioned research efforts.
Using Insufficient Sample Sizes
Small sample sizes produce unreliable statistics that credible sources won’t cite. A survey of 50 respondents might reveal interesting patterns, but the margin of error makes findings statistically meaningless.
Determine required sample size before beginning research. Online calculators help estimate needs based on population size and desired confidence levels. Budget for adequate sample sizes or choose different research methods.
Be transparent about sample limitations. If resource constraints limit your sample size, acknowledge this clearly. Some audiences accept smaller samples for niche topics where larger samples aren’t feasible.
Publishing Unverified or Misleading Data
Inaccurate statistics damage credibility permanently. Once your brand becomes associated with unreliable data, rebuilding trust is extremely difficult.
Verify all data before publication. Double-check calculations, review methodology for errors, and have someone outside the research team review findings.
Avoid cherry-picking results. Presenting only favorable findings while hiding contradictory data is misleading. Comprehensive reporting builds long-term credibility even when some findings are less exciting.
Poor Data Presentation and Visualization
Confusing presentations prevent your statistics from being cited. If writers can’t quickly understand and extract your data, they’ll find alternative sources.
Prioritize clarity over creativity. Innovative visualizations that obscure the data defeat the purpose. Simple, clear charts communicate better than complex graphics.
Test comprehension with outside reviewers. People unfamiliar with your research should understand key findings within seconds of viewing your presentation.
Failing to Promote Statistics Effectively
Great statistics that nobody knows about don’t earn links. Publication without promotion wastes research investment.
Develop promotion plans before publishing. Identify target audiences, outreach lists, and distribution channels as part of your research planning.
Sustain promotion over time. Initial launch generates attention, but ongoing promotion captures opportunities as new writers discover needs for your data.
Not Making Data Easy to Cite
Friction in the citation process reduces link acquisition. Every obstacle between discovery and citation costs you potential backlinks.
Provide clear citation guidance. Show exactly how to reference your data and what link to use.
Ensure statistics pages load quickly and work on mobile. Technical issues that prevent access prevent citations.
Real-World Examples of Successful Statistics-Based Link Building
Examining successful campaigns reveals patterns and strategies that drive results. These examples illustrate different approaches to statistics-based link building.
Industry Survey Case Study
A B2B software company wanted to establish authority in their niche. They surveyed 1,200 professionals in their target industry about challenges, priorities, and technology adoption.
The research revealed several surprising findings that contradicted industry assumptions. They published results as an annual report with a dedicated statistics page highlighting key data points.
Within the first year, the report earned links from 47 unique domains, including three major industry publications. The statistics page now ranks for multiple “[industry] statistics” queries, generating ongoing organic link acquisition.
Original Research Report Case Study
A marketing agency conducted original research on content performance across 10,000 blog posts from their client portfolio. They analyzed factors correlating with traffic, engagement, and conversion.
The research produced specific, actionable findings about optimal content length, formatting, and topic selection. They published findings as a comprehensive report with embeddable charts.
The report became a frequently cited source for content marketing statistics. Over two years, it accumulated links from 200+ domains and continues generating 5-10 new links monthly without active promotion.
Data Aggregation Project Case Study
A startup lacked resources for original research but identified a gap in their industry: no comprehensive source compiled statistics from multiple studies into a single reference.
They created a statistics page aggregating data from 50+ sources, organized by topic with clear citations. The page provided genuine value through curation and organization rather than original data.
The aggregation page earned links from writers who appreciated having a single reference point. While individual statistics linked to original sources, the compilation page itself attracted links as a valuable resource.
How to Scale Statistics-Based Link Building
Moving from occasional research to systematic data production multiplies results. Scaling requires infrastructure, processes, and strategic planning.
Creating an Annual Research Series
Annual research creates recurring content opportunities and builds longitudinal datasets. Each year’s report generates fresh links while previous years’ data continues attracting citations.
Choose research topics with ongoing relevance. Trends, benchmarks, and sentiment data naturally support annual updates. One-time topics don’t scale into series.
Maintain consistent methodology across years. Changing methods makes year-over-year comparisons invalid. Document methodology thoroughly and resist temptation to “improve” in ways that break continuity.
Building a Data-Driven Content Calendar
Plan research investments across the year rather than pursuing ad-hoc projects. A content calendar ensures consistent output and efficient resource allocation.
Align research timing with industry cycles. Publishing benchmark data before annual planning season maximizes relevance. Trend reports released at year-end capture attention during reflection periods.
Balance research types across the calendar. Mix quick-turnaround projects with longer-term studies. This maintains consistent publication velocity while allowing for ambitious research.
Repurposing Statistics Across Multiple Formats
Single research investments should produce multiple content pieces. Repurposing maximizes ROI and reaches different audience segments.
Transform reports into blog posts, infographics, social content, and presentations. Each format reaches different audiences and creates additional link opportunities.
Update and refresh existing statistics. Adding new data to existing pages maintains relevance without requiring entirely new research. Updated statistics often earn links from sites that cited previous versions.
Establishing Your Brand as a Data Authority
Consistent, quality research builds reputation over time. Becoming known as a reliable data source creates compounding advantages.
Develop recognizable research branding. Consistent naming, visual identity, and publication schedules help audiences recognize and anticipate your research.
Engage with your research community. Respond to questions about methodology, participate in discussions about your findings, and acknowledge when others build on your work.
Conclusion: Building Long-Term Authority Through Original Data
Statistics-based link building represents a fundamental shift from chasing links to earning them. By creating valuable data assets, you position your brand as a primary source that others naturally reference and cite.
The approach requires upfront investment in research methodology, data collection, and content creation. However, the returns compound over time as your statistics gain visibility and your reputation for reliable data grows.
At White Label SEO Service, we help businesses develop and execute statistics-based link building strategies that build sustainable organic authority. Our team handles everything from research design to publication and promotion, delivering high-quality backlinks that drive long-term SEO results. Contact us to discuss how original data can transform your link building results.
Frequently Asked Questions
How much does statistics-based link building cost compared to traditional outreach?
Initial investment is typically higher—quality research requires proper methodology, adequate sample sizes, and professional presentation. However, cost per link often decreases over time as statistics continue earning citations without ongoing effort. Many businesses find statistics-based approaches more cost-effective over 12-24 month periods.
How long does it take to see results from statistics-based link building?
Expect 3-6 months before significant link acquisition begins. Research, publication, and initial promotion take time, and statistics need to gain visibility before writers discover and cite them. Results typically accelerate after the first year as your data becomes established in search results.
What sample size do I need for credible survey research?
For most business applications, 300-500 respondents provides acceptable statistical validity with margins of error around ±5%. Smaller samples work for narrow, specialized populations. Larger samples enable more granular segmentation and analysis.
Can small businesses compete with larger companies in statistics-based link building?
Yes. Niche focus often provides advantages. Large companies produce broad industry statistics, but specific data for narrow segments remains scarce. Small businesses with deep expertise in particular areas can create statistics that larger competitors overlook.
How do I know if my statistics are newsworthy enough to earn links?
Newsworthy statistics typically share characteristics: they’re surprising, specific, timely, or fill clear information gaps. Test newsworthiness by asking whether a journalist could write a headline around your finding. If the data only confirms what everyone already believes, it likely won’t generate significant interest.
Should I gate my statistics behind lead capture forms?
Generally, no. Gated content dramatically reduces citation potential because writers can’t easily access and verify your data. The link-building value of freely accessible statistics typically exceeds the lead generation value of gated reports. Consider offering ungated statistics with gated deeper analysis.
How often should I update my statistics to maintain link-building value?
Annual updates work well for most statistics types. More frequent updates may be warranted for rapidly changing topics. Clearly communicate update schedules so writers know when to expect fresh data. Outdated statistics lose citation appeal as writers seek current information.


