
Tracking the right SEO metrics separates SaaS companies that scale from those that stagnate. Most SaaS marketers monitor rankings and traffic but miss the metrics connecting organic search to recurring revenue, trial signups, and customer lifetime value.
The subscription model demands different measurement approaches. Unlike e-commerce, where a single transaction defines success, SaaS success unfolds over months and years through renewals, expansions, and reduced churn.
This guide breaks down every SEO metric that matters for SaaS growth. You’ll learn which numbers to track, how to build reporting dashboards, and how to present organic channel value to leadership with confidence.
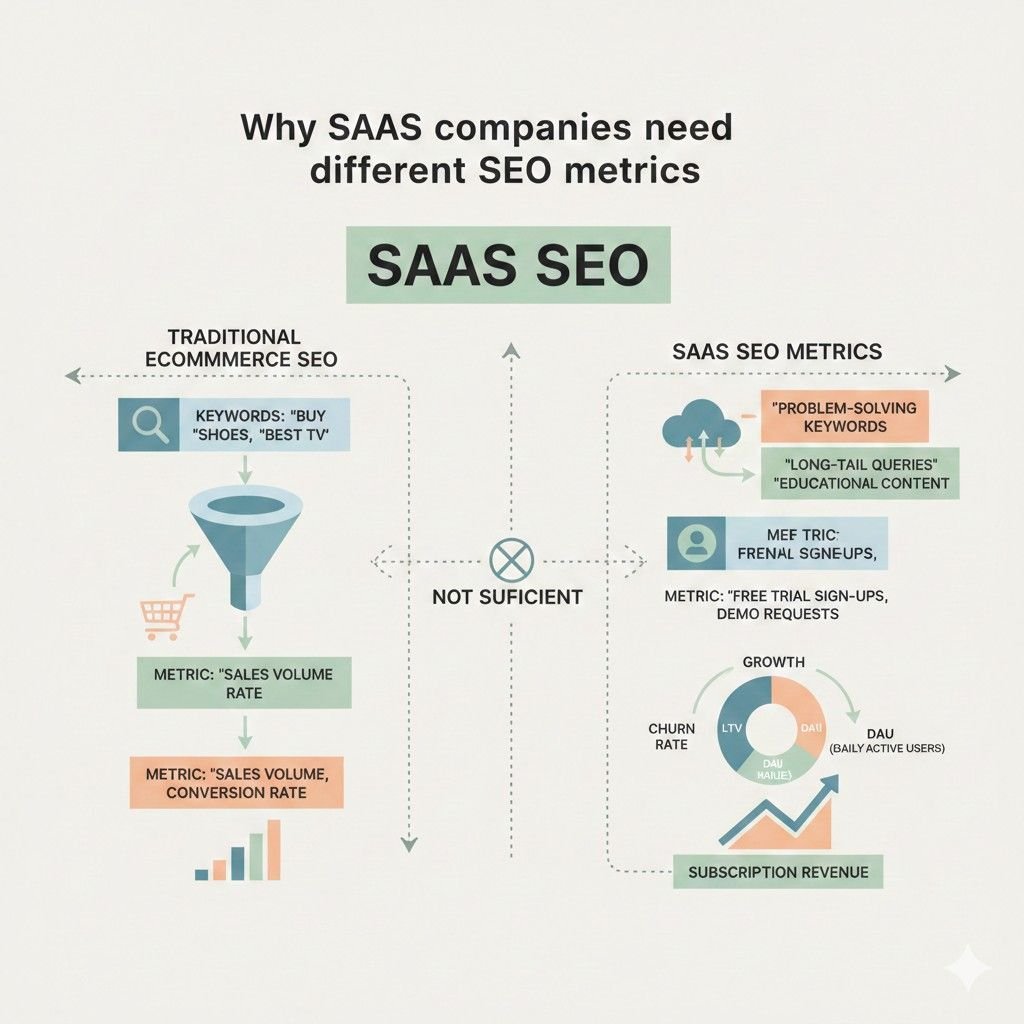
Why SaaS Companies Need Different SEO Metrics
Traditional SEO metrics fail SaaS businesses because they ignore the subscription revenue model. Pageviews and bounce rates tell you almost nothing about whether organic traffic converts to paying customers who stay for years.
SaaS companies need metrics that track the entire customer journey. From first touch through trial activation to annual contract renewal, organic search influences every stage. Measuring only top-of-funnel activity misses most of the value SEO creates.
The SaaS Business Model and SEO Alignment
SaaS revenue compounds over time. A customer acquired through organic search in January might generate revenue for five years. This fundamentally changes how you should measure SEO success.
Customer acquisition cost matters more than traffic volume. If organic search delivers 1,000 visitors who convert at 2% with a $500 average contract value, that channel produces $10,000 in first-year revenue. But the real value emerges when you factor in retention rates and expansion revenue.
The subscription model also means SEO supports multiple business functions. Product pages drive trials. Help documentation reduces churn. Comparison content captures buyers evaluating alternatives. Each content type requires different success metrics.
Monthly recurring revenue (MRR) influenced by organic search becomes your north star metric. Everything else supports this number.
Vanity Metrics vs. Revenue-Driving Metrics
Vanity metrics look impressive in reports but don’t connect to business outcomes. Revenue-driving metrics directly influence growth decisions.
Common vanity metrics in SaaS SEO:
- Total organic sessions without funnel segmentation
- Keyword rankings without intent classification
- Domain authority as an isolated number
- Page speed scores without conversion correlation
- Backlink counts without quality assessment
Revenue-driving alternatives:
- Organic sessions by funnel stage and conversion rate
- Rankings for high-intent commercial keywords
- Authority trends relative to direct competitors
- Core Web Vitals impact on trial signup rates
- Referring domains from industry-relevant sources
The distinction matters for resource allocation. Teams chasing vanity metrics optimize the wrong pages, target the wrong keywords, and build the wrong links. Revenue-focused measurement keeps SEO efforts aligned with business growth.
Traffic Metrics That Impact SaaS Growth
Not all organic traffic carries equal value. SaaS companies need granular traffic analysis that reveals which visitors actually matter for growth.
Organic Traffic by Funnel Stage
Segment organic traffic by where visitors enter your marketing funnel. This reveals whether SEO drives awareness, consideration, or decision-stage prospects.
Top-of-funnel traffic comes from educational content. Blog posts answering industry questions, guides explaining concepts, and thought leadership pieces attract people who may not know your product exists. Track volume trends and email capture rates.
Middle-of-funnel traffic arrives on comparison pages, feature explanations, and use case content. These visitors understand their problem and evaluate solutions. Monitor time on page and progression to pricing or demo pages.
Bottom-of-funnel traffic hits pricing pages, competitor comparison pages, and integration documentation directly from search. These visitors have high purchase intent. Measure trial signup rates and demo request conversions.
Google Analytics 4 allows custom channel groupings by landing page URL patterns. Create segments for /blog/, /features/, /pricing/, and /vs-competitor/ paths to automate funnel-stage reporting.
Branded vs. Non-Branded Traffic
Branded traffic comes from searches including your company or product name. Non-branded traffic comes from generic industry terms.
This distinction reveals SEO’s true contribution to growth. Branded searches often result from other marketing activities like paid ads, PR, or word of mouth. Non-branded organic traffic represents pure SEO value.
Track the ratio over time. Healthy SaaS SEO programs show non-branded traffic growing faster than branded traffic. If branded traffic dominates, SEO isn’t expanding your reach to new audiences.
Google Search Console provides this data through query filtering. Export queries monthly, classify them as branded or non-branded, and track the split. Most mature SaaS companies target 60-70% non-branded organic traffic as a benchmark.
Traffic Quality Indicators
Raw session counts hide traffic quality problems. Add these quality signals to your reporting:
Engaged sessions in GA4 measure visits lasting longer than 10 seconds, having a conversion event, or viewing multiple pages. Compare engaged session rates across landing pages to identify content that attracts qualified visitors.
New vs. returning visitor ratio indicates whether organic search brings fresh prospects or just serves existing users. High returning visitor rates on blog content suggest you’re not reaching new audiences.
Geographic distribution matters for SaaS companies with regional pricing or language limitations. Traffic from non-serviceable regions inflates numbers without business value.
Device category affects conversion potential. Mobile organic traffic typically converts at lower rates for B2B SaaS. Track device splits and adjust expectations accordingly.
Keyword Performance Metrics for SaaS
Keywords remain fundamental to SEO measurement, but SaaS companies need sophisticated approaches beyond simple rank tracking.
Keyword Rankings by Intent Category
Classify your target keywords by search intent before tracking rankings. This prevents celebrating wins that don’t drive business results.
Informational keywords signal research behavior. “What is customer success software” indicates early-stage exploration. Rankings here build awareness but rarely drive immediate conversions.
Commercial investigation keywords show active evaluation. “Best customer success platforms 2025” or “Gainsight alternatives” indicate buyers comparing options. These rankings directly influence pipeline.
Transactional keywords demonstrate purchase readiness. “Customer success software pricing” or “[Your Product] free trial” capture decision-stage prospects. Prioritize these in your tracking dashboard.
Navigational keywords include branded searches and product-specific queries. Track these for competitive defense rather than growth.
Weight your keyword tracking toward commercial and transactional terms. A position 3 ranking for a high-intent keyword often delivers more value than position 1 for an informational query.
Share of Voice (SOV) in Your Market
Share of voice measures your visibility relative to competitors across your target keyword set. It provides context that individual rankings miss.
Calculate SOV by tracking rankings for all relevant keywords in your market, weighting by search volume, and comparing your visibility percentage to competitors.
Tools like Semrush, Ahrefs, and Sistrix automate SOV tracking. Set up competitor groups and monitor monthly changes.
SOV trends predict market share changes. Research from Les Binet and Peter Field demonstrates that brands with share of voice exceeding market share tend to grow, while those below tend to shrink.
For SaaS, track SOV across different keyword categories. You might dominate informational terms but lag on commercial keywords where revenue actually happens.
Keyword Gap Analysis Metrics
Keyword gaps reveal opportunities your competitors capture that you miss. Regular gap analysis keeps your SEO strategy competitive.
Track these gap metrics monthly:
Total gap keywords counts terms where competitors rank and you don’t. Large numbers indicate content opportunities.
High-value gap keywords filters for commercial intent terms with meaningful search volume. These represent immediate revenue opportunities.
Gap closure rate measures how many previously missing keywords you’ve captured over time. This shows SEO program momentum.
Competitive displacement tracks keywords where you’ve overtaken specific competitors. Celebrate these wins and analyze what worked.
Ahrefs Content Gap and Semrush Keyword Gap tools automate this analysis. Export data quarterly for trend tracking.
Conversion Metrics That Connect SEO to Revenue
Traffic metrics mean nothing without conversion data. SaaS SEO measurement must connect organic visits to revenue-generating actions.
Organic Conversion Rate by Page Type
Different page types serve different conversion goals. Measure each appropriately.
Blog posts should capture email signups and content downloads. Track micro-conversion rates (newsletter subscriptions, gated content downloads) rather than expecting direct trial signups.
Feature pages should drive demo requests or trial starts. Measure conversion rates and compare across features to identify which capabilities attract buyers.
Pricing pages represent high-intent traffic. Track both trial starts and demo requests. Low conversion rates here indicate pricing presentation problems, not SEO issues.
Comparison pages targeting “[Competitor] alternative” keywords should convert at high rates. These visitors have purchase intent and seek validation. Benchmark against 3-5% trial signup rates for well-optimized comparison content.
Integration pages attract users of connected tools. Track both new trial signups and existing user engagement to measure full value.
Set up conversion tracking in GA4 with separate events for each action type. Create custom reports showing conversion rates by landing page category.
Trial Signups and Demo Requests from Organic
These metrics directly connect SEO to pipeline. Track them obsessively.
Organic trial signups measures free trial starts from organic search visitors. This is your primary SEO conversion metric for product-led growth models.
Organic demo requests matters more for sales-led models. Track form submissions from organic traffic and monitor quality through sales feedback.
Assisted conversions captures organic’s role in multi-touch journeys. A visitor might discover you through organic search, leave, return through paid ads, and convert. GA4’s attribution reports reveal this influence.
First-touch attribution shows where customer relationships begin. Even if organic doesn’t get last-click credit, first-touch data reveals SEO’s role in filling the top of your funnel.
Compare organic conversion rates to other channels monthly. Healthy SaaS SEO programs deliver conversion rates 1.5-2x higher than paid search because organic visitors often have stronger intent.
Marketing Qualified Leads (MQLs) from SEO
Not every trial signup or demo request becomes a qualified opportunity. Track MQL rates from organic traffic to measure true lead quality.
Connect your CRM data to marketing analytics. Salesforce, HubSpot, and similar platforms allow source tracking through UTM parameters and integration with GA4.
Organic MQL rate divides marketing qualified leads by total organic conversions. Compare this to other channels to validate traffic quality.
MQL-to-SQL rate from organic measures how many marketing qualified leads become sales qualified. Low rates might indicate targeting the wrong keywords or attracting the wrong audience segments.
Pipeline value from organic sums the potential deal value of opportunities sourced from organic search. This connects SEO directly to revenue forecasts.
Track these metrics monthly and report quarterly trends to leadership. Pipeline influence often matters more than traffic volume for executive buy-in.
Customer Acquisition Cost (CAC) from Organic
CAC measures the total cost to acquire a customer through a specific channel. Organic search typically delivers the lowest CAC of any scalable acquisition channel.
Calculate organic CAC by dividing total SEO investment (team salaries, tools, content production, link building) by customers acquired through organic search.
Blended organic CAC includes all SEO costs. This provides the true channel efficiency number.
Marginal organic CAC measures the cost of acquiring one additional customer. As SEO programs mature, marginal CAC often decreases because existing content continues generating traffic without additional investment.
Compare organic CAC to paid search, paid social, and other channels. According to FirstPageSage’s 2024 analysis, organic search CAC runs 60-70% lower than paid search for most B2B SaaS companies.
Track CAC trends over time. Effective SEO programs show declining CAC as content assets compound and domain authority grows.
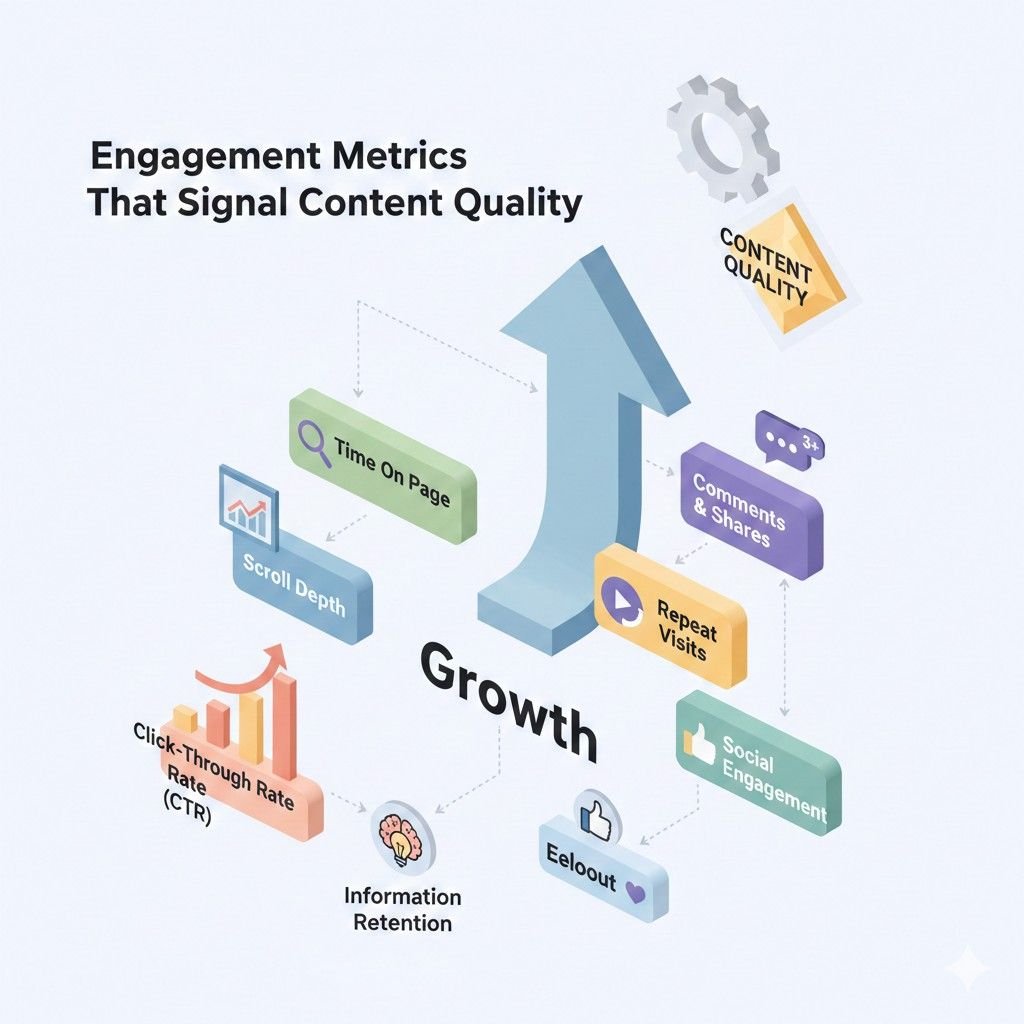
Engagement Metrics That Signal Content Quality
Engagement metrics reveal whether your content satisfies user intent. Strong engagement signals help rankings; weak signals hurt them.
Time on Page and Scroll Depth
Time on page indicates content relevance and quality. Longer times generally suggest visitors found what they needed.
Context matters for interpretation. A 30-second average on a pricing page might be excellent (visitors quickly found information and converted), while the same time on a comprehensive guide suggests problems.
Benchmark by content type:
- Blog posts: 2-4 minutes average
- Feature pages: 1-2 minutes average
- Documentation: 3-5 minutes average
- Pricing pages: 1-3 minutes average
Scroll depth reveals how much content visitors actually consume. Track 25%, 50%, 75%, and 100% scroll milestones through GA4 events.
Low scroll depth on long-form content indicates front-loading problems. Visitors aren’t finding value quickly enough to continue reading.
Pages Per Session from Organic Entry
Pages per session measures how deeply organic visitors explore your site. Higher numbers indicate content that encourages further engagement.
Track this metric by landing page category. Blog visitors viewing 1.5 pages on average is normal. Feature page visitors viewing only 1.2 pages suggests navigation or internal linking problems.
Healthy benchmarks for SaaS:
- Blog entry: 1.5-2.5 pages per session
- Feature entry: 2-3 pages per session
- Pricing entry: 2-4 pages per session
- Documentation entry: 3-5 pages per session
Create internal linking strategies based on this data. Pages with low pages-per-session need better pathways to related content.
Return Visitor Rate from Organic
Return visitors from organic search indicate content worth revisiting. This signals quality to search engines and builds brand familiarity.
Track the percentage of organic sessions from returning users. Segment by content type to understand what brings people back.
High return rates on documentation suggest users find your help content valuable. High return rates on blog content indicate you’re building an audience.
Target benchmarks:
- Overall organic: 20-30% returning visitors
- Blog content: 15-25% returning visitors
- Documentation: 40-60% returning visitors
Low return rates across all content types suggest you’re not building lasting relationships with your audience.
Technical SEO Metrics for SaaS Websites
Technical health directly impacts rankings and user experience. SaaS sites often have complex architectures requiring careful monitoring.
Core Web Vitals Performance
Core Web Vitals measure real-user experience and influence rankings. Google uses these metrics as ranking signals.
Largest Contentful Paint (LCP) measures loading performance. Target under 2.5 seconds for good scores. SaaS sites with heavy JavaScript often struggle here.
Interaction to Next Paint (INP) replaced First Input Delay in 2024. It measures responsiveness throughout the page lifecycle. Target under 200 milliseconds.
Cumulative Layout Shift (CLS) measures visual stability. Target under 0.1. Dynamic content loading and ad placements commonly cause problems.
Track Core Web Vitals through Google Search Console’s Core Web Vitals report. Monitor the percentage of URLs with good, needs improvement, and poor scores.
Prioritize fixing pages with poor scores that receive significant organic traffic. A slow pricing page hurts conversions more than a slow archived blog post.
Crawlability and Indexation Health
Search engines must crawl and index your pages before they can rank. Monitor these metrics to catch problems early.
Crawl budget utilization matters for large SaaS sites. Check Google Search Console’s crawl stats to ensure Googlebot accesses important pages frequently.
Index coverage shows how many pages Google has indexed versus how many you’ve submitted. Large gaps indicate crawlability or quality problems.
Crawl errors in Search Console reveal pages Googlebot can’t access. Fix 404s, server errors, and redirect chains promptly.
Orphan pages exist on your site but lack internal links. These pages rarely rank well. Run regular crawls with Screaming Frog or Sitebulb to identify orphans.
For SaaS sites with user-generated content, gated areas, or dynamic applications, ensure important pages remain crawlable while blocking low-value pages through robots.txt or noindex tags.
Site Architecture Efficiency
Site architecture affects how link equity flows and how easily users navigate. Measure architecture health through these metrics:
Click depth measures how many clicks from the homepage reach any given page. Important pages should be within 3 clicks. Deep pages rarely rank well.
Internal link distribution shows which pages receive the most internal links. Your most important commercial pages should receive the most internal links.
Crawl depth from site audit tools reveals how search engines navigate your site. Compare crawl depth to click depth to identify navigation problems.
URL structure consistency affects both users and search engines. Audit for inconsistent patterns, unnecessary parameters, and overly long URLs.
Run monthly technical audits using tools like Screaming Frog, Sitebulb, or Ahrefs Site Audit. Track key metrics over time to catch degradation before it impacts rankings.
Authority and Backlink Metrics
Backlinks remain a primary ranking factor. SaaS companies need quality-focused link metrics rather than pure quantity measures.
Domain Authority/Rating Trends
Domain Authority (Moz) and Domain Rating (Ahrefs) estimate your site’s overall link strength. While not Google metrics, they correlate with ranking ability.
Track your score monthly alongside direct competitors. The absolute number matters less than your position relative to competitors.
Healthy growth rates:
- New SaaS sites: 2-5 points per quarter
- Established sites: 1-2 points per quarter
- Market leaders: Maintenance focus
Sudden drops indicate lost links or algorithm updates. Investigate promptly.
Don’t obsess over these scores. They’re proxies for actual ranking ability, not direct ranking factors. Use them for competitive benchmarking and trend analysis.
Referring Domain Growth Rate
Referring domains count unique websites linking to you. Growth rate matters more than absolute numbers.
Monthly referring domain growth shows link building momentum. Track new referring domains acquired each month.
Net referring domain growth accounts for lost links. Some link loss is natural, but net negative growth indicates problems.
Competitor comparison contextualizes your growth. If competitors add 50 referring domains monthly while you add 10, you’re falling behind regardless of absolute numbers.
Set growth targets based on competitive analysis. Match or exceed your closest competitors’ link acquisition rates.
Link Quality and Relevance Scores
Not all links carry equal value. Quality metrics prevent celebrating worthless link wins.
Domain authority of linking sites indicates link strength. Links from high-authority sites pass more value than links from weak sites.
Topical relevance measures whether linking sites relate to your industry. A link from a SaaS review site carries more relevance than a link from a general business directory.
Link placement affects value. Editorial links within content outperform footer links, sidebar links, or author bio links.
Anchor text distribution should appear natural. Over-optimized anchor text (too many exact-match keywords) can trigger penalties.
Audit your backlink profile quarterly. Remove or disavow toxic links. Prioritize acquiring links from relevant, authoritative sources in your industry.
Content Performance Metrics
Content drives SaaS SEO success. Measure content performance to optimize your editorial strategy.
Content Decay and Refresh Indicators
Content decay happens when pages lose rankings and traffic over time. Identifying decay early allows timely refreshes.
Traffic decline percentage flags pages losing organic visits. Set alerts for pages dropping more than 20% month-over-month.
Ranking position changes reveal decay before traffic drops. Monitor position changes for your top 50 pages weekly.
Content age correlates with decay risk. Pages older than 18 months often need updates to maintain rankings.
SERP feature loss indicates competitive displacement. Track featured snippet ownership and People Also Ask appearances.
Create a content refresh calendar based on decay signals. Prioritize high-traffic pages showing early decline indicators.
Topic Cluster Performance
Topic clusters group related content around pillar pages. Measure cluster performance holistically.
Cluster traffic sums organic traffic across all pages in a topic cluster. This reveals total topical visibility.
Pillar page performance tracks the main hub page’s rankings and traffic. Strong pillar pages lift entire clusters.
Supporting content contribution measures how cluster pages drive traffic to pillar pages through internal links.
Cluster conversion rate calculates conversions from all cluster pages combined. Some clusters drive awareness; others drive revenue.
Compare cluster performance to identify your strongest topics. Double down on high-performing clusters and diagnose underperformers.
Featured Snippet and SERP Feature Wins
SERP features provide visibility beyond traditional blue links. Track your presence in these enhanced results.
Featured snippet ownership for target keywords drives significant click-through. Monitor wins and losses weekly.
People Also Ask appearances expand your visibility across related queries. Track PAA presence for core topics.
Knowledge panel presence matters for branded searches. Ensure your company information appears correctly.
Image pack and video carousel appearances drive traffic for visual content. Track these for relevant queries.
SERP feature tracking requires specialized tools. Semrush Position Tracking, Ahrefs Rank Tracker, and similar platforms monitor feature presence automatically.
How to Build a SaaS SEO Reporting Dashboard
Effective dashboards transform raw data into actionable insights. Build dashboards that serve different stakeholder needs.
Essential Metrics to Include
Structure your dashboard around the metrics that matter most for SaaS growth.
Executive summary section:
- Organic revenue influence (pipeline and closed deals)
- Organic CAC trend
- Share of voice vs. competitors
- MQL volume from organic
Traffic section:
- Total organic sessions with trend
- Non-branded traffic percentage
- Traffic by funnel stage
- Engaged session rate
Conversion section:
- Trial signups from organic
- Demo requests from organic
- Conversion rate by page type
- Assisted conversions
Rankings section:
- High-intent keyword positions
- Share of voice trend
- Featured snippet wins
- New keyword rankings
Technical health section:
- Core Web Vitals scores
- Index coverage status
- Crawl error count
- Page speed trends
Reporting Frequency and Stakeholder Views
Different stakeholders need different reporting cadences and detail levels.
Weekly reports for SEO team members include granular ranking changes, technical issues, and content performance. Focus on actionable items requiring immediate attention.
Monthly reports for marketing leadership summarize traffic trends, conversion performance, and competitive positioning. Include context for significant changes and recommendations for next month.
Quarterly reports for executives connect SEO to business outcomes. Lead with revenue influence, CAC efficiency, and market share gains. Minimize technical details.
Create dashboard views tailored to each audience. Looker Studio (formerly Data Studio) allows multiple report pages with different metric focuses.
Tools for SaaS SEO Measurement
Build your measurement stack with tools that integrate well and provide accurate data.
Google Search Console provides authoritative ranking and impression data directly from Google. Essential for any SEO program.
Google Analytics 4 tracks on-site behavior and conversions. Configure enhanced measurement and custom events for complete tracking.
Ahrefs or Semrush delivers competitive intelligence, backlink analysis, and rank tracking. Choose one as your primary platform.
Looker Studio creates custom dashboards pulling from multiple data sources. Free and flexible for most reporting needs.
Screaming Frog or Sitebulb runs technical audits. Essential for monitoring site health.
CRM integration (Salesforce, HubSpot) connects marketing data to sales outcomes. Critical for revenue attribution.
Budget approximately $500-1,500 monthly for a complete SaaS SEO measurement stack, depending on site size and tool choices.
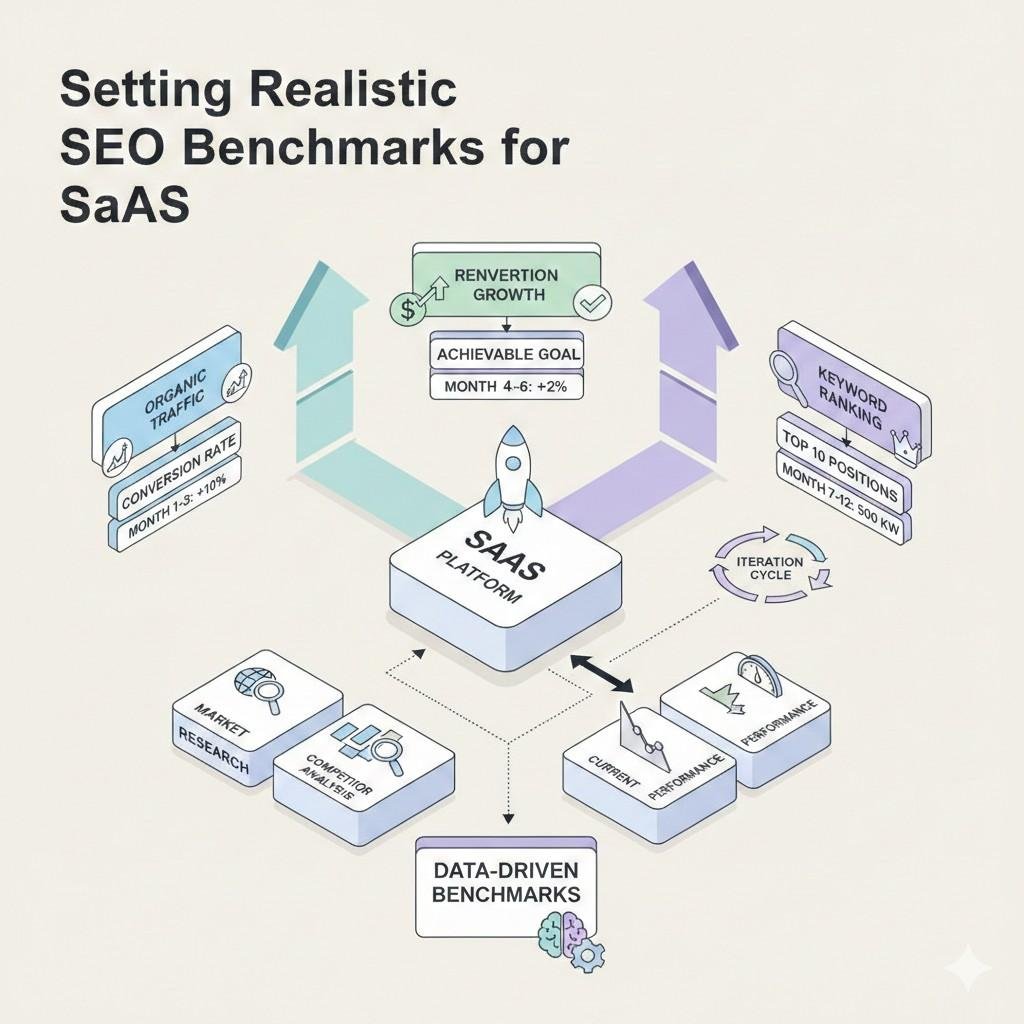
Setting Realistic SEO Benchmarks for SaaS
Benchmarks provide context for your metrics. Set realistic expectations based on your company stage and market.
Industry Benchmarks by SaaS Category
Different SaaS categories face different competitive landscapes. Adjust expectations accordingly.
Horizontal SaaS (CRM, project management, communication) faces intense competition. Expect slower ranking improvements and higher content investment requirements.
Vertical SaaS (industry-specific solutions) often finds less competitive keywords. Faster wins are possible, but total addressable search volume is smaller.
Developer tools compete for technical audiences with specific search behaviors. Documentation and technical content often outperform marketing content.
SMB-focused SaaS targets higher-volume, lower-intent keywords. Conversion rates tend to be lower, but traffic potential is higher.
Enterprise SaaS targets lower-volume, higher-intent keywords. Smaller traffic numbers but higher conversion rates and deal values.
Research your specific competitors rather than relying on general benchmarks. Your direct competitors’ performance sets your realistic targets.
Early-Stage vs. Growth-Stage Metrics
Company stage dramatically affects which metrics matter and what numbers are achievable.
Early-stage SaaS (pre-product-market fit):
- Focus on learning which keywords convert
- Accept lower traffic volumes
- Prioritize conversion rate optimization over traffic growth
- Track keyword rankings for core product terms
- Benchmark: 500-5,000 monthly organic sessions
Growth-stage SaaS (scaling):
- Expand keyword targeting aggressively
- Build content velocity and topical authority
- Track share of voice and competitive displacement
- Measure organic’s contribution to pipeline
- Benchmark: 10,000-100,000 monthly organic sessions
Mature SaaS (market leader):
- Defend rankings against competitors
- Optimize for efficiency and ROI
- Track organic CAC trends
- Focus on content refresh over new content
- Benchmark: 100,000+ monthly organic sessions
Avoid comparing your early-stage metrics to mature competitors. Focus on growth rate rather than absolute numbers.
Timeline Expectations for Metric Improvement
SEO results compound over time. Set realistic timeline expectations to avoid premature strategy changes.
Months 1-3: Technical fixes show impact. Indexation improvements, crawl error resolution, and site speed gains can produce quick wins. New content begins indexing but rarely ranks competitively yet.
Months 4-6: Content starts gaining traction. Early blog posts find their ranking positions. Internal linking improvements distribute authority. Backlink campaigns begin showing results.
Months 7-12: Compounding effects emerge. Content library builds topical authority. Domain authority increases measurably. Organic traffic growth accelerates.
Year 2+: SEO becomes a reliable growth channel. Organic CAC decreases as existing content generates traffic without additional investment. Market share gains become visible in share of voice metrics.
According to Ahrefs research, only 5.7% of pages rank in the top 10 within one year of publication. Plan for 12-18 month timelines for significant organic growth.
Common SaaS SEO Measurement Mistakes to Avoid
Even experienced teams make measurement errors that lead to poor decisions. Avoid these common pitfalls.
Focusing on Rankings Without Context
Rankings alone tell an incomplete story. A position 1 ranking for a zero-volume keyword delivers no value.
Add context to ranking reports:
- Search volume for each tracked keyword
- Click-through rate estimates
- Conversion potential based on intent
- Competitive difficulty scores
Track rankings for keywords that matter to your business, not vanity keywords that look impressive but don’t drive results.
Avoid celebrating ranking improvements without verifying traffic and conversion impact. Sometimes rankings improve while traffic decreases due to SERP feature changes or declining search volume.
Ignoring Attribution Complexity
Customer journeys rarely follow single-channel paths. Organic search often influences conversions attributed to other channels.
Attribution models to consider:
- Last-click attribution (default, but misleading)
- First-click attribution (shows discovery channel)
- Linear attribution (equal credit across touchpoints)
- Data-driven attribution (GA4’s algorithmic approach)
Review assisted conversions in GA4 to understand organic’s full influence. Many SaaS companies find organic search initiates 30-50% of customer journeys even when last-click attribution credits other channels.
Build multi-touch attribution into your reporting. Present both last-click and influenced metrics to show organic’s complete value.
Measuring Too Early or Too Late
Timing matters for SEO measurement. Measuring too early leads to premature conclusions; measuring too late misses optimization opportunities.
Too early mistakes:
- Judging new content performance within 30 days
- Expecting ranking improvements from technical fixes within weeks
- Abandoning keyword targets after 3 months without results
Too late mistakes:
- Discovering content decay after 50% traffic loss
- Finding technical issues only during quarterly audits
- Noticing competitive displacement months after it began
Recommended measurement cadences:
- Technical metrics: Weekly monitoring
- Ranking changes: Weekly tracking, monthly analysis
- Traffic trends: Monthly analysis
- Conversion performance: Monthly analysis
- Content performance: Quarterly deep dives
- Strategic metrics (SOV, CAC): Quarterly reviews
Set up automated alerts for significant changes. Catch problems early without obsessing over daily fluctuations.
Connecting SEO Metrics to Business Outcomes
SEO metrics only matter when connected to business results. Learn to translate technical metrics into language leadership understands.
Calculating SEO ROI for SaaS
ROI calculation proves SEO’s value and justifies continued investment.
Basic SEO ROI formula: (Revenue from Organic – SEO Investment) / SEO Investment × 100
For SaaS, expand the calculation:
- Include first-year contract value from organic customers
- Factor in expected lifetime value based on retention rates
- Account for expansion revenue from organic-sourced accounts
- Subtract full SEO costs (team, tools, content, links)
Example calculation:
- Annual SEO investment: $150,000
- Organic-sourced customers: 200
- Average first-year contract: $5,000
- First-year revenue: $1,000,000
- ROI: ($1,000,000 – $150,000) / $150,000 = 567%
Track ROI quarterly and annually. Most mature SaaS SEO programs deliver 300-1,000% ROI when measured correctly.
Lifetime Value (LTV) Impact from Organic
Organic-sourced customers often have different LTV than customers from other channels. Measure this to understand true channel value.
Track by cohort:
- Retention rates for organic vs. paid customers
- Expansion revenue by acquisition source
- Support ticket volume by source
- Net promoter scores by source
Many SaaS companies find organic customers have 10-30% higher LTV than paid acquisition customers. Organic visitors often have stronger intent and better product fit.
If your data shows organic customers retain better, factor this into CAC comparisons. A higher organic CAC might still deliver better unit economics when LTV differences are included.
Presenting SEO Value to Leadership
Executives care about business outcomes, not SEO metrics. Translate your data into their language.
Lead with business impact:
- “Organic search generated $2.4M in pipeline this quarter”
- “Our organic CAC dropped 23% year-over-year”
- “We captured 15% more market share in search visibility”
Provide competitive context:
- “We now outrank [Competitor] for 67% of target keywords”
- “Our share of voice increased from 12% to 18%”
- “We’ve closed the content gap on three major competitors”
Connect to strategic goals:
- “SEO supports our expansion into the enterprise segment”
- “Organic growth reduces our dependence on paid acquisition”
- “Content investments compound, reducing future CAC”
Create executive summaries that fit on one page. Save detailed metrics for appendices or follow-up questions.
Conclusion
Measuring SaaS SEO effectively requires moving beyond vanity metrics to revenue-connected measurement. Track traffic by funnel stage, conversions by page type, and authority growth relative to competitors. Build dashboards that serve different stakeholders and set realistic benchmarks based on your company stage.
The metrics outlined in this guide connect organic search performance to business outcomes that matter. From trial signups and MQL quality to customer acquisition cost and lifetime value, every measurement should answer the question: “How does SEO contribute to sustainable growth?”
At White Label SEO Service, we help SaaS companies build measurement frameworks that prove organic channel value. Our team implements tracking systems, creates executive-ready dashboards, and delivers the strategic insights that drive informed decisions. Contact us to discuss how we can support your SaaS SEO measurement and growth objectives.
Frequently Asked Questions
What is the most important SEO metric for SaaS companies?
Organic customer acquisition cost (CAC) matters most because it directly connects SEO investment to business outcomes. While traffic and rankings indicate progress, CAC reveals whether organic search efficiently acquires customers compared to other channels.
How long does it take to see results from SaaS SEO efforts?
Most SaaS companies see meaningful organic traffic growth within 6-12 months of consistent SEO investment. Technical improvements show faster results (1-3 months), while content and link building require longer timelines to compound.
What tools do I need to measure SaaS SEO performance?
Essential tools include Google Search Console, Google Analytics 4, and one competitive intelligence platform like Ahrefs or Semrush. Add Looker Studio for dashboard creation and your CRM for revenue attribution.
How do I calculate organic search ROI for my SaaS business?
Divide revenue from organic-sourced customers by total SEO investment, then multiply by 100. Include first-year contract value and consider lifetime value for a complete picture. Most mature programs achieve 300-1,000% ROI.
What’s a good organic conversion rate for SaaS websites?
Blog content typically converts at 1-3% for email signups. Feature and pricing pages should convert at 2-5% for trial signups or demo requests. Comparison pages targeting competitor alternatives often achieve 3-7% conversion rates.
How often should I report on SaaS SEO metrics?
Weekly monitoring catches technical issues and ranking changes. Monthly reports suit marketing leadership with traffic and conversion summaries. Quarterly reviews work best for executives focusing on ROI and strategic metrics.
What’s the difference between vanity metrics and revenue-driving metrics?
Vanity metrics look impressive but don’t connect to business outcomes, like total traffic without funnel segmentation. Revenue-driving metrics directly influence growth decisions, like organic trial signups, MQL quality, and customer acquisition cost.


