White label SEO partner performance is measured through a combination of ranking movement, organic traffic growth, technical health, and revenue impact rather than any single number. I’ve seen too many businesses judge a partnership on rankings alone, only to discover six months later that traffic never converted into revenue. We built this framework because performance measurement in SEO is where most partnerships either earn trust or quietly fall apart.
Most SEO reporting fails not because the work is bad, but because the wrong metrics get prioritized. A ranking report looks impressive. It doesn’t tell you if the business grew.
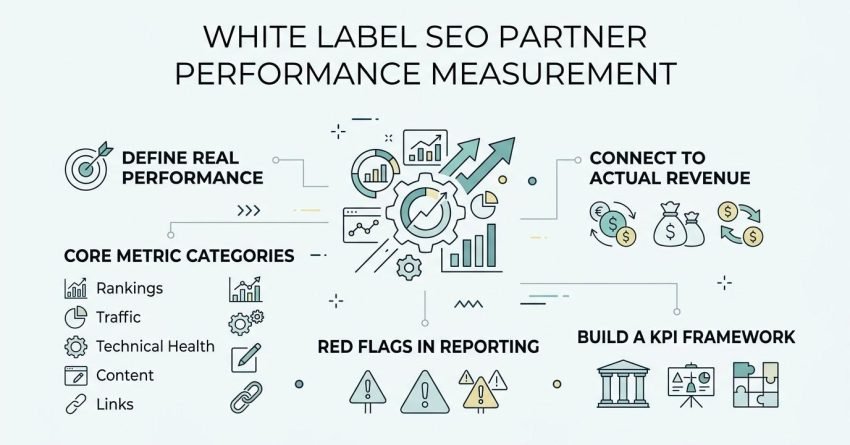
This guide covers how to define real performance, the core metric categories rankings, traffic, technical health, content, and links how those metrics connect to actual revenue, what red flags to watch for in reporting, and how to build a KPI framework with your partner that holds up over time.
What “Performance” Actually Means in a White Label SEO Partnership
Performance in a white label SEO partnership means measurable progress toward business outcomes, not just movement in search engine rankings. I think of it as a chain: technical work leads to crawlability, crawlability leads to rankings, rankings lead to traffic, and traffic leads to leads or sales. Break any link in that chain and “performance” becomes a hollow word.
Most agencies report on the easiest metrics to pull, not the ones that matter most to the business paying for the work. That gap is exactly what causes friction three or four months into a contract.
Leading vs. Lagging SEO Indicators
Leading indicators are the early signals: crawl health, indexation, content published, links earned. Lagging indicators are the outcomes: traffic, rankings, conversions, revenue. I always tell clients to track both, because leading indicators without lagging results eventually mean something isn’t working, and lagging results without leading activity usually mean luck, not strategy.
A partner who only reports lagging metrics is hiding the process. A partner who only reports leading metrics is hiding the outcome.
Rankings and Visibility Metrics
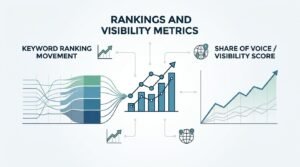
Keyword rankings measure where your pages appear in search results for target queries, and they remain the most immediate signal of SEO progress. Rankings move faster than traffic in most cases, which makes them a useful early-warning metric rather than a final scorecard. We watch this closely in the first 90 days of any campaign.
Rankings alone can mislead, though. A page can rank on page one for a keyword nobody searches, and the report still looks great.
Keyword Ranking Movement
Keyword ranking movement tracks how target terms shift up or down over time, typically pulled weekly or monthly from a rank tracking tool. I look for movement across a full keyword set, not just the two or three “hero” terms an agency likes to showcase. Aggregate ranking distribution how many keywords sit in positions 1 to 3, 4 to 10, and 11 to 20 tells a far more honest story than any single keyword’s position.
Share of Voice / Visibility Score
Share of voice measures the percentage of available search visibility a domain captures across its full keyword set compared to competitors. According to Semrush’s visibility index methodology, this metric aggregates ranking position and search volume into a single trend line, which makes it far more resistant to cherry-picking than isolated keyword reports. I use visibility score as a sanity check whenever a monthly report only highlights a handful of wins.
Organic Traffic Metrics That Matter
Organic traffic measures the volume of visitors arriving at a website through unpaid search results, and it’s the metric most directly tied to whether SEO work is actually reaching people. Traffic growth should track roughly alongside ranking and visibility gains. When it doesn’t, something in the technical or content layer usually needs attention.
I’ve reviewed campaigns where rankings improved for months while traffic stayed flat, and the cause was almost always thin meta descriptions or declining click-through rates.
Organic Sessions and Users
Organic sessions count total visits from search, while organic users count unique visitors, and tracking both distinguishes repeat engagement from new audience growth. Pulled from Google Analytics, this pairing shows whether a site is expanding its reach or simply getting revisited by the same audience.
Traffic Quality vs. Traffic Volume
Traffic quality measures how engaged and relevant incoming visitors are, while traffic volume simply counts how many arrive, and the two numbers can move in completely opposite directions. Bounce rate, pages per session, and average session duration each help separate a genuinely improving campaign from one that’s inflating numbers with irrelevant keywords. I’d rather see 2,000 highly relevant monthly visitors than 10,000 who leave in five seconds.
Technical SEO Health Metrics
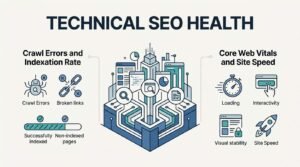
Technical SEO health measures how easily search engines can crawl, render, and index a website’s pages, and it forms the foundation every other metric depends on. No amount of content or link building compensates for a site search engines can’t properly access. This is usually the least visible layer in a client report and the most important.
I always ask new clients whether their previous agency ever showed them a crawl report. Most say no.
Crawl Errors and Indexation Rate
Crawl errors are pages search engines attempted to access but couldn’t, while indexation rate measures what percentage of submitted pages actually appear in the search index. Google Search Console’s coverage report surfaces both directly, and a rising error count or falling indexation rate is an early warning sign long before traffic drops.
Core Web Vitals and Site Speed
Core Web Vitals are Google’s set of page experience metrics measuring loading performance, interactivity, and visual stability. Google’s own research found that sites meeting Core Web Vitals thresholds saw 24% fewer abandonment events during page loads. Site speed problems tend to suppress rankings quietly, without triggering an obvious drop anywhere else in a report.
On-Page and Content Performance Metrics
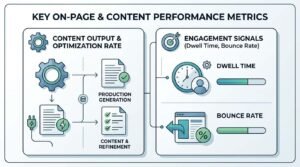
Content performance metrics measure how well individual pages attract search visibility, engage readers, and support target keyword rankings once published. A content plan on paper means nothing until execution and results get measured against it. This is where a lot of SEO retainers quietly underdeliver.
I check content velocity against the original strategy every single month, not just at renewal time.
Content Output and Optimization Rate
Content output tracks how many new pages or articles get published against the agreed schedule, and optimization rate tracks how many existing pages get updated or improved. A partner falling behind on output without flagging it is the single most common reason SEO timelines slip.
Engagement Signals (Dwell Time, Bounce Rate)
Dwell time measures how long a visitor stays on a page after clicking from search results, while bounce rate measures the percentage who leave without further interaction. Both signals hint at whether content actually satisfies the search intent it was built to target, even though neither is a confirmed direct Google ranking factor.
Link Building and Authority Metrics
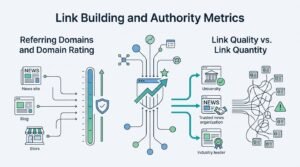
Link building metrics measure the volume and quality of external websites linking back to a domain, which search engines use as a trust and authority signal. Authority builds slowly and compounds, which makes it one of the hardest metrics to fake convincingly over a long period. I treat this category as a long-game indicator, not a monthly scorecard.
A partner reporting ten new links a month with zero context on where those links came from is a reporting gap worth questioning immediately.
Referring Domains and Domain Rating
Referring domains count the number of unique websites linking to a domain, while domain rating estimates overall backlink authority on a relative scale. An Ahrefs study of two million websites found that referring domain count correlated more strongly with top-10 rankings than total backlink count did. I watch referring domain growth month over month far more closely than raw link totals.
Link Quality vs. Link Quantity
Link quality measures the relevance, authority, and trustworthiness of the sites linking in, while link quantity simply counts how many links exist regardless of source. A partner chasing quantity over quality is usually setting a client up for a future penalty or a Google manual action review.
Conversion and Revenue Metrics (The Business-Outcome Layer)
Conversion and revenue metrics measure what organic traffic actually produces for the business: leads, sales, bookings, or revenue, and this is where SEO performance ultimately gets judged. Everything above this section is a leading or supporting metric. This is the one that answers whether the investment was worth it.
I push every client to connect their analytics goals to actual revenue tracking before month two of any campaign, because retrofitting that connection later means losing months of clean historical data.
Goal Completions and Lead Volume
Goal completions track specific conversion actions form fills, calls, sign-ups configured inside Google Analytics or a similar platform, and lead volume aggregates those completions into a monthly total. Segmenting goal completions by organic traffic specifically, rather than all traffic sources combined, is the only way to isolate what SEO is actually contributing.
Organic Revenue and ROAS
Organic revenue attributes actual sales dollars to organic search traffic, typically through e-commerce tracking or CRM-to-analytics integration, and it’s the clearest expression of SEO ROI available. BrightEdge’s 2024 channel research found organic search drives over 53% of all trackable website traffic across the industries it studied, which underscores why revenue attribution to this channel matters so much. Return on ad spend doesn’t technically apply to organic work, but I calculate an equivalent organic revenue against total SEO spend for every client who asks about ROI.
Local SEO Performance Metrics (If Applicable)
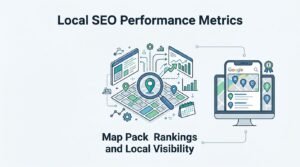
Local SEO performance metrics measure visibility and engagement specifically within geographically bound searches, most visibly through Google’s Map Pack results. Businesses with physical locations or defined service areas need this layer tracked separately from general organic performance. Skipping it means missing where a large share of local buying intent actually happens.
Map Pack Rankings and Local Visibility
Map Pack rankings measure a business’s position within Google’s three-result local map listing for geographically relevant searches. Local visibility tracking tools monitor these rankings across multiple search locations within a service area, since map pack results can vary block by block in dense metro markets.
SEO ROI Calculation Framework
SEO ROI is calculated by comparing the total revenue generated from organic traffic against the total cost of the SEO investment over the same time period. The formula itself is simple. The hard part is getting clean, attributable data feeding into it every month.
I build this calculation once at campaign start and revisit it quarterly rather than trying to reconstruct it from memory a year later.
Customer Lifetime Value and Organic CAC
Customer lifetime value estimates the total revenue a business can expect from a single customer across the full relationship, while organic customer acquisition cost measures SEO spend divided by customers acquired through organic channels. Comparing these two numbers reveals whether organic search is a sustainably profitable channel or a break-even one worth revisiting.
Reporting Cadence and Transparency Standards
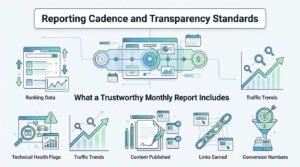
Reporting cadence refers to how often a white label SEO partner delivers performance updates, and transparency standards define how much raw, verifiable data that report actually contains. Monthly reporting is the industry standard for a reason: it’s frequent enough to catch problems early without drowning a business in noise. I’ve worked with partners who reported quarterly, and by the time issues surfaced, three months of budget was already spent.
What a Trustworthy Monthly Report Includes
A trustworthy monthly report includes ranking data, traffic trends, technical health flags, content published, links earned, and conversion numbers, all tied back to the original strategy. Raw access to Google Search Console and Analytics, not just screenshots, separates a transparent partner from one hiding behind curated slides.
Red Flags: Vanity Metrics and Misleading Reporting
Vanity metrics are numbers that look impressive in a report but carry little connection to actual business results, and they’re the most common way SEO underperformance gets disguised. I’ve reviewed dozens of client reports built almost entirely around metrics chosen for how good they look rather than what they mean. Recognizing the pattern takes about ten minutes once you know what to check.
Common Reporting Tricks to Watch For
Total keywords ranked, without position context, is one of the most common inflated metrics, since a keyword ranking at position 87 counts the same as one ranking at position 3 in a raw count. Impressions reported without click-through rate, branded traffic counted as organic growth, and raw backlink counts with no quality filter round out the most frequent tricks I see in underperforming campaigns.
Benchmarking Performance Against Realistic SEO Timelines
Realistic SEO timelines set the expectations against which every other metric in this guide should be measured, since a metric that looks flat at month two can be completely normal. Judging performance against the wrong timeline is one of the fastest ways a good partnership gets ended prematurely. I walk every new client through this timeline before the first report ever lands.
What Good Progress Looks Like at 3, 6, and 12 Months
At three months, expect technical fixes completed, initial content published, and early ranking movement on lower-competition terms. By six months, meaningful traffic growth and mid-tier keyword rankings should be visible. By twelve months, Ahrefs’ study of two million keywords found only 5.7% of pages reach the top 10 within a year, which is a useful reality check against inflated early promises.
Tools Used to Track White Label SEO Performance
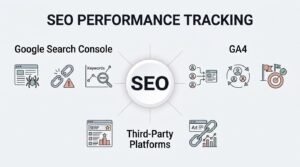
SEO performance tracking relies on a combination of free platforms and paid tools that each measure a different layer of the metrics covered in this guide. No single tool covers rankings, traffic, technical health, and conversions all at once with full accuracy. A capable partner uses several in combination and shows you the raw dashboards.
Google Search Console, GA4, and Third-Party Platforms
Google Search Console tracks indexation, crawl errors, and search query performance directly from Google’s own data. GA4 tracks traffic, engagement, and conversion behavior once configured correctly. Third-party rank trackers and backlink analysis platforms fill in the competitive and authority-tracking gaps neither free tool covers on its own.
Building a KPI Framework With Your White Label Partner
A KPI framework is a documented, agreed-upon set of metrics, targets, and review checkpoints that both a business and its SEO partner commit to before work begins. Without one, “performance” becomes whatever number happens to look good that month. I insist on building this framework in the first strategy call, not after the first report is already late.
Setting Baselines, Targets, and Review Cycles
Baselines document where every core metric stood before work began, targets define what success looks like at 90, 180, and 365 days, and review cycles set fixed dates to compare actual results against those targets. This structure turns vague monthly check-ins into an accountable, measurable partnership.
Conclusion
Measuring white label SEO performance means tracking rankings, traffic, technical health, content, and links together, not any single number in isolation.
These metrics connect directly to the broader timelines and ranking factors that shape realistic organic growth across any industry.
We build every partnership around this exact framework at White Label SEO Service, so reach out when you’re ready for measurable, accountable results.
Frequently Asked Questions
What KPIs should I ask my white label SEO partner to report on?
Ask for rankings, organic traffic, technical health, content output, referring domains, and conversion data every month. These six categories together reveal whether SEO work is actually driving business results.
How long does it take to see measurable SEO results?
Most campaigns show early ranking movement within 3 months and meaningful traffic growth by 6 months. Full authority-driven results typically take 9 to 12 months to compound.
What is a good organic traffic growth rate to expect monthly?
A healthy campaign often shows 10% to 20% month-over-month organic traffic growth after the first quarter. Growth rates vary significantly by industry, competition, and starting point.
How do I know if my SEO reporting is inflated or misleading?
Check whether keyword counts include low-value rankings, whether impressions are reported without click-through rate, and whether branded traffic gets counted as organic growth. These three patterns are the most common inflation tactics.
What’s the difference between rankings and actual ROI?
Rankings measure search position, while ROI measures actual revenue generated against total SEO spend. A page can rank well and still contribute nothing to revenue if it targets the wrong keywords.
How often should a white label SEO partner report on performance?
Monthly reporting is the industry standard, giving enough frequency to catch problems early. Quarterly reporting often lets issues go unnoticed for too long.
What tools do agencies use to track SEO performance?
Google Search Console and GA4 form the free foundation, covering indexation, traffic, and conversions. Paid rank trackers and backlink platforms fill in competitive and authority-tracking gaps.