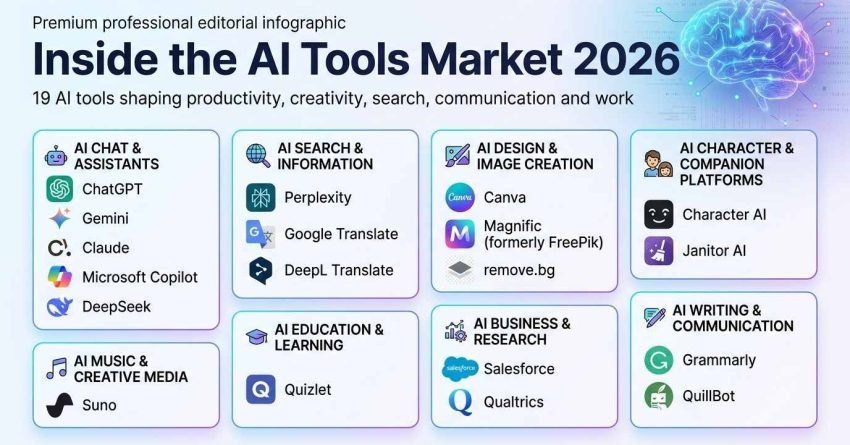
Artificial intelligence tools pulled 144.5 billion web visits over the twelve months to April 2026, and nearly nine in ten of those visits landed on just 100 platforms. We reached that figure by tracking 9,531 AI tools across more than 170 categories for a full 24 months, then comparing the latest year against the one before it.
The market grew 40.12% year over year. The Top 100 grew faster still at 49.94%, which tells us attention is not just expanding, it is tightening around fewer names. Against the wider web, though, AI still accounts for only 4.20% of the 3.44 trillion visits we tracked across 10,173 major websites.
This study walks through the full ranking of the Top 100 and a tool-by-tool deep dive of the Top 20, then breaks the market into its ten largest categories and shows which ones are gaining or bleeding visits. From there we cover how to read traffic estimates without misjudging them, how to separate a durable leader from a one-month spike, why single-purpose tools keep losing ground, where adoption runs deepest by country, what all of this means for organic search strategy, and where we expect the market to move next. We close with our methodology, the confidence levels behind each figure, and answers to the questions readers ask most.
Quick Navigation
Key Findings
The seven results that matter most, covering total market size, growth rate, concentration, the single tool that dominates it, the categories rising and falling, and where adoption runs deepest by population.
How to read this study
What a web visit measures, what it leaves out, and why certain broad software products with strong AI components sit inside this dataset.
How to Read Web Visit Data Without Drawing the Wrong Conclusion
Five interpretation errors that turn a solid traffic dataset into a misleading one, plus a short checklist to run before you quote any figure here.
Top 100 Most Popular AI Tools: Infographic and Full Data Table Ranking
The complete ranking, with each tool’s category, both twelve-month totals, absolute change, year-over-year growth, and two market-share columns.
Deep Dive: Top 20 Most Popular AI Tools
Twenty individual profiles built from 24 months of monthly data, each explaining the shape of the trend rather than just the annual total.
Top 10 AI Tool Categories & Category Breakdowns
The ten largest categories by visits, a concentration table showing which markets remain open, then the top ten tools inside each of those categories.
Momentum Check: What’s Rising and Falling in AI
Which categories and tools added the most visits, which lost the most, and a four-test framework for judging whether momentum is likely to hold.
The Unbundling Effect
Why narrow single-task tools keep losing visits, and the four conditions that predict which category gets absorbed next.
Which Country Has the Highest AI Adoption?
Adoption measured per 100,000 people rather than by raw volume, which reorders the ranking completely.
What 144.5 Billion AI Web Visits Mean for Search Marketers
How this shift in traffic maps onto keyword demand, content planning, technical work, and measurement.
AI Predictions for 2026–2027, Conclusion, Methodology, Limitations and FAQ
Where the data points next, how we built it, how far each figure can be pushed, and the questions we get asked most.
Key Findings:
AI tools drew 144.5 billion visits, and 89.69% of them went to 100 platforms
The 9,531 tools we tracked generated 144.5 billion web visits in the twelve months to April 2026, up 40.12% from the previous year. The Top 100 alone took 129.6 billion of those visits and grew 49.94%, giving them an 89.69% share of everything we measured. The remaining 9,431 tools split just over a tenth of the market between them.
AI is everywhere in conversation and still holds only 4.20% of tracked web traffic
The 10,173 major websites in our wider tracking set produced 3.44 trillion visits over the same period. AI tools contributed 144.5 billion of those, or 4.20%. That gap between cultural presence and actual traffic share is the single most useful number in this study for anyone planning ahead, because it shows the runway is still long.
ChatGPT is not leading the market so much as containing it
ChatGPT recorded 64.7 billion visits, equal to 44.76% of the entire AI tools market and 49.92% of everything inside the Top 100. Canva placed second at 10.5 billion. That leaves the leader with more than six times the traffic of the next tool on the list, and roughly the same volume as the other 99 members of the Top 100 put together.
The challengers are growing fast, and the absolute gap is still widening ChatGPT added 26.6 billion visits year over year on 69.80% growth, more than any other tool in the study. Gemini posted the second-largest absolute gain at 5.6 billion visits on 450.33% growth, Claude added 2.4 billion at 250.07%, and Grok grew 731.26% to 2.5 billion. Percentage growth favours the challengers. Absolute growth still favours the incumbent.
Study, writing, and translation tools are giving up ground across the board
Google Translate shed 1.5 billion visits, down 23.46%, the largest absolute decline anywhere in the ranking. Chegg fell 61.45%, Quizlet dropped 29.09%, and QuillBot lost 25.24%. These are not tools losing to a stronger direct rival. Each still leads its own category while the category itself contracts.
Chatbots now hold more than half the market on their own
The chatbot category climbed from 45.1 billion to 86.0 billion visits, a 90.82% increase, and reached a 59.52% share of all AI tool traffic. Translators moved the other way, losing 1.6 billion visits at a 22.52% decline. One category absorbed the growth of several others.
Singapore uses AI most intensely, the United States generates the most of it
Singapore recorded 16.1 million AI visits per 100,000 residents from a population of 5.9 million. The Netherlands followed at 9.8 million, ahead of the United States at 8.4 million. The US still produced the highest raw volume at 29.2 billion visits, which is exactly why intensity and volume need separate rankings.
How to read this study:
This study measures estimated web visits. It does not measure unique users, revenue, subscriptions, mobile app sessions, or API calls. A visit tells us that someone loaded a page, and nothing more than that.
That makes the metric excellent for comparing public demand and discovery patterns across thousands of tools on a single consistent basis. It makes the metric weak for judging depth of use, commercial value, or how much work actually got done inside a product.
A handful of entries here are broad software platforms rather than pure AI products, including Salesforce, Zoom, Canva, and HubSpot. We kept them because AI features now sit at the centre of how those products are marketed, classified, and used, and excluding them would understate how much AI adoption happens inside familiar tools rather than new ones.
How to Read Web Visit Data Without Drawing the Wrong Conclusion
Traffic datasets get misquoted more often than almost any other kind of marketing data. The numbers are precise, which makes them feel definitive, and that combination invites conclusions the data cannot actually support. Five errors account for most of the trouble.
Error one: treating visits as usage.
A tool used once a week in a browser generates roughly 52 visits a year. A tool used ten times a day inside an existing app generates almost none. Copilot, Salesforce, and Zoom all lose visibility in this metric precisely because their heaviest use happens after login or inside desktop software.
Error two: reading a decline as abandonment.
When a category shrinks while every tool inside it holds its relative position, the task has usually moved rather than disappeared. Translation volume almost certainly rose over this period. Translation site visits fell.
Error three: mistaking percentage growth for market impact.
A tool growing 1,000% from 370,000 visits adds less to the market than a tool growing 15% from 9.1 billion. Both are real. Only one changes the ranking.
Error four: assuming a single peak month sets the level.
Several tools in this study hit a record month and then settled 30% to 40% below it. The sustained band matters more than the high-water mark, which is why every deep dive below quotes a monthly range rather than a single figure.
Error five: comparing tools across different distribution models.
A standalone website competes for visits. A feature bundled into an operating system, a browser, or an office suite does not need to. Comparing the two on visits alone flatters the standalone product.
Before quoting any number from this study, run four checks. Confirm whether the tool is primarily browser-based or app-based. Confirm whether the change is absolute or percentage. Confirm whether the trend held across at least six months. Confirm whether the category as a whole moved in the same direction, because a tool falling inside a rising category is a very different story from a tool falling inside a collapsing one.
Top 100 AI Tools in 2026: Infographic and Full Ranking by Web Visits
Once we had the full picture across 9,531 tools, the obvious next question was where the demand actually pooled. The answer sits almost entirely at the top of the list.
The Top 100 produced 129.6 billion visits between May 2025 and April 2026. That is 89.69% of everything we tracked, from a group representing barely 1% of the tools in the dataset. Concentration at that level means the Top 100 is not a highlights list. It is a reasonable proxy for the market itself.
The infographic below covers those 100 tools. It shows the ranking by total visits, how sharply visits cluster at the top, the monthly growth curve for the group as a whole, which categories contribute most inside the ranking, and where adoption runs deepest by country.
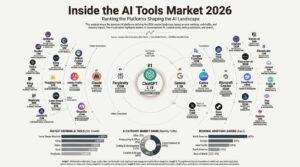
The data table that follows carries the exact figures behind that visual. For each tool it lists the category, both twelve-month totals, the absolute change between them, year-over-year growth, share of the total AI tools market, and share within the Top 100. Reading the two market-share columns side by side is the fastest way to see how top-heavy the ranking really is.
Ranking the Top 100 Most Popular AI Tools in the World by Web Visits (may 2024 – apr 2026)
Deep Dive: Top 20 Most Popular AI Tools in the World by Web Visits in 2026
Concentration does not stop at the Top 100. The first twenty tools alone account for roughly 77% of every AI tool visit we tracked, so the clearest behavioural shifts in the market all show up inside this group.
What makes these twenty worth examining individually is that they are not moving together. Growth here comes from at least four distinct patterns, and the annual totals hide all of them.
ChatGPT is expanding at a scale nothing else approaches. Gemini, Claude, Grok, DeepSeek, and Perplexity are all climbing as chatbot competition intensifies, but along visibly different curves. Canva, Suno, and JanitorAI are growing inside their own categories without competing for the same use case at all.
Moving the other way, Google Translate, Quizlet, Grammarly, DeepL, and QuillBot all lost visits while keeping their category leadership. That combination points to something structural rather than competitive, and we return to it later in the study.
The visual below ranks the top twenty by total visits from May 2025 to April 2026. It is the clearest way to see the distance between the leaders and everyone else.
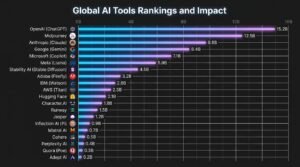
Annual totals only describe the destination, though. They cannot tell you whether a tool climbed all year steadily, broke out in a single month and then flattened, peaked early and slid back, or barely moved at all. Four tools with identical growth rates can have four completely different stories underneath.
So each profile below works from the full 24-month monthly series alongside the year-over-year change, market share, and category position. The aim is to explain not just how large each tool became, but what shape it took getting there and what that shape suggests about the months ahead.
#1. ChatGPT
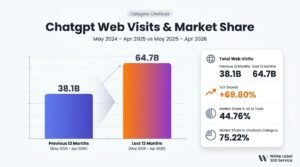
Key Data:
- Category: Chatbots
- Total Web Visits (may 2025 – apr 2026): 64.7B
- Total Web Visits (may 2024 – apr 2025): 38.1B
- Market Share in All AI Tools: 44.76%
- Market Share in Chatbots Category: 75.22%
- YoY Growth: +69.80%
Nothing else in this dataset demonstrates market concentration as plainly as the first entry. ChatGPT recorded 64.7 billion visits over the latest twelve months against 38.1 billion the year before, taking 44.76% of every AI tool visit we tracked.
Set against the rest of the ranking, the scale becomes easier to feel. ChatGPT’s 64.7 billion visits sit almost level with the 64.9 billion produced by the other 99 tools in the Top 100 combined.
The monthly series shows growth that was large but uneven. Visits ran at 2.1 billion in May 2024 and 5.2 billion by April 2026, with the latest twelve months mostly holding between 4.6 billion and 6.2 billion. The peak came in March 2026 at 6.19 billion before April settled back to 5.20 billion.
That pattern matters more than the annual figure. ChatGPT has not been climbing steadily month after month. It has shifted into a much higher operating band where an ordinary monthly fluctuation now moves hundreds of millions of visits in either direction.
The breadth of use explains much of the volume. This is no longer a tool people open to ask a question. It absorbs coding, research, study, planning, drafting, and routine work that previously required several separate products. A 69.80% annual increase at this size tells us adoption is still widening even while Gemini, DeepSeek, Claude, and Grok take share of their own.
#2. Canva
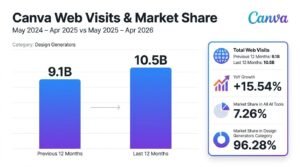
Key Data:
- Category: Design Generators
- Total Web Visits (may 2025 – apr 2026): 10.5B
- Total Web Visits (may 2024 – apr 2025): 9.1B
- Market Share in All AI Tools: 7.26%
- Market Share in Design Generators Category: 96.28%
- YoY Growth: +15.54%
Second place breaks the pattern most people expect. It is not another chatbot. Canva took 10.5 billion visits over the latest twelve months, up from 9.1 billion, adding 1.4 billion at a scale where growth of any size is difficult.
Its position inside its own category is close to absolute. Canva holds 96.28% of all Design Generator visits, and its annual total exceeds the combined figures for DeepSeek, Claude, and Grok.
The monthly trend rose without being smooth. Canva averaged roughly 757 million visits a month across the first twelve months and about 875 million across the latest twelve. March 2026 set a new high at 1.02 billion before April eased to 825.6 million.
The interesting part is how that growth arrived. Canva did not persuade people to adopt a new AI product. It added AI to a workspace they already used for decks, social graphics, and everyday design, so the features met users inside an existing habit rather than asking for a new one.
That distribution advantage explains the gap to everyone else in the category far better than the 15.54% growth rate does. A moderate rate applied to an enormous base still added more visits than most tools in this study generated in total.
#3. Gemini
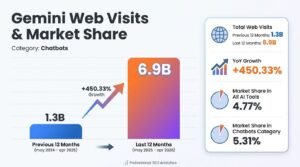
Key Data:
- Category: Chatbots
- Total Web Visits (may 2025 – apr 2026): 6.9B
- Total Web Visits (may 2024 – apr 2025): 1.3B
- Market Share in All AI Tools: 4.77%
- Market Share in Chatbots Category: 5.31%
- YoY Growth: +450.33%
Third place returns to chatbots, and to the strongest challenge in the dataset. Gemini reached 6.9 billion visits over the latest twelve months against 1.3 billion the year before, an absolute gain of 5.6 billion that ranks second across all 9,531 tools.
April 2026 alone brought 1.05 billion visits, close to eight times the 133.3 million recorded in April 2025.
The monthly curve is what makes this notable rather than the headline rate. Gemini opened the latest period at 186.9 million in May 2025, cleared 400 million by September, hit 679.9 million in December, and passed 800 million in January 2026 before peaking at 1.13 billion in March and easing to 1.05 billion in April.
Nothing about that shape resembles a spike. Average monthly visits moved from roughly 104 million in the earlier period to about 574 million in the latest one, and the gains arrived in consecutive steps rather than one jump. That is the signature of distribution being switched on across a large existing product surface.
Scale still separates the two leaders by a wide margin. ChatGPT generated roughly 9.4 times Gemini’s volume over the same twelve months. Gemini is now unambiguously the closest challenger, and it is still a long way behind.
#4. Google Translate
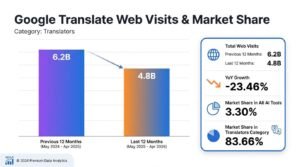
Key Data:
- Category: Translators
- Total Web Visits (may 2025 – apr 2026): 4.8B
- Total Web Visits (may 2024 – apr 2025): 6.2B
- Market Share in All AI Tools: 3.30%
- Market Share in Translators Category: 83.66%
- YoY Growth: -23.46%
Fourth place is where the ranking changes direction for the first time. Google Translate remains the most-visited translation tool anywhere, with 4.8 billion visits over the latest twelve months, and it still lost 1.5 billion visits year over year. That is the largest absolute decline in the entire Top 100.
The size of that loss deserves a moment. The 1.46 billion visits Google Translate gave up exceed everything Microsoft Copilot generated across the full latest period, and the tool still holds 83.66% of its category.
The monthly series rules out a one-month anomaly. Google Translate ran between 457 million and 562 million visits a month through the first year. The latest period opened at 499.1 million in May 2025, fell under 400 million by November, and bottomed at a 24-month low of 314.7 million in February 2026. March recovered to 419.2 million before April slipped again to 349.6 million.
What makes the decline structural rather than competitive is that category leadership never wavered. No rival translator took those visits. The category itself is under pressure.
The most plausible explanation is substitution rather than abandonment. Translation now happens inside chatbots, browsers, and document editors where a user can translate, rewrite, question, and continue working without opening anything new. The task survived. The visit did not.
#5. DeepSeek
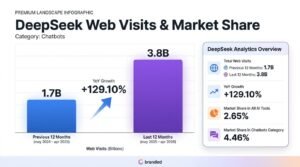
Key Data:
- Category: Chatbots
- Total Web Visits (may 2025 – apr 2026): 3.8B
- Total Web Visits (may 2024 – apr 2025): 1.7B
- Market Share in All AI Tools: 2.65%
- Market Share in Chatbots Category: 4.46%
- YoY Growth: +129.10%
From a slow decline, we move to the sharpest arrival in the dataset. DeepSeek was almost invisible through most of 2024, drawing between 1 and 8 million visits a month, before jumping into fifth place with 3.8 billion visits across the latest twelve months.
The turn was extraordinarily abrupt. Monthly visits went from 8.1 million in December 2024 to 520.2 million in February 2025, a rise of more than 64 times inside two months.
What happened afterwards is the more instructive part. DeepSeek did not hold that February peak. It settled into a band of roughly 262 million to 340 million visits a month for most of the latest period and closed at 297.9 million in April 2026, far above its origin and well below its high.
That pattern deserves its own label. This was a spike that retained, not a spike that collapsed, and the two behave very differently in a ranking. Retention after a breakout is what converts a news event into a market position.
Its 129.10% annual growth therefore describes a step change rather than a climb. DeepSeek secured a permanent place among the largest chatbots in a matter of weeks, and ChatGPT still produced roughly 17 times its volume over the same twelve months.
#6. Claude
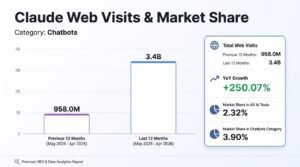
Key Data:
- Category: Chatbots
- Total Web Visits (may 2025 – apr 2026): 3.4B
- Total Web Visits (may 2024 – apr 2025): 958.0M
- Market Share in All AI Tools: 2.32%
- Market Share in Chatbots Category: 3.90%
- YoY Growth: +250.07%
Where DeepSeek arrived all at once, Claude took the opposite route. For most of the 24 months, it climbed gradually, moving from 48.0 million visits in May 2024 to around 220 million by early 2026. Then the curve steepened sharply.
Against its nearest rival, the year finished decisively. Claude’s 3.4 billion visits beat Grok’s 2.5 billion by roughly 879.2 million, or 35.5%, across the same twelve months.
The closing months are what stand out in the monthly series. Claude sat at 287.9 million visits in February 2026 and had nearly tripled that by April. Unlike DeepSeek, whose breakout cooled steadily afterwards, Claude ended our observation window at its highest recorded point.
That late run carried the annual total from 958.0 million to 3.4 billion, a 250.07% increase. The data cannot tell us what triggered it, and the direction of travel is unambiguous.
A tool finishing a study period at peak momentum is the hardest kind to forecast, because the trend has not yet had time to prove itself. Claude’s next two quarters will settle whether this was a step change or the start of something steeper as it competes with Gemini, DeepSeek, Grok, and Perplexity.
#7. Grok
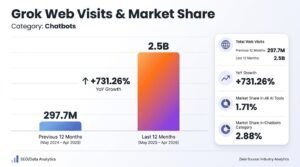
Key Data:
- Category: Chatbots
- Total Web Visits (may 2025 – apr 2026): 2.5B
- Total Web Visits (may 2024 – apr 2025): 297.7M
- Market Share in All AI Tools: 1.71%
- Market Share in Chatbots Category: 2.88%
- YoY Growth: +731.26%
Grok sits directly behind Claude with a completely different growth signature. It produced 2.5 billion visits from May 2025 to April 2026 against 297.7 million the previous year, and its 731.26% increase was the fastest rate anywhere in the Top 10.
Put in absolute terms, Grok multiplied its annual audience more than eightfold in a single year while every tool above it grew from a much larger base.
The monthly detail shows the acceleration weighted towards the back half. Visits went from 125.7 million in May 2025 to 227.0 million in November, reached 265.5 million in January 2026, and peaked at 365.1 million in March. April fell to 255.9 million, still more than double where the period started.
That April dip is worth reading carefully. A single month below peak after a steep climb is normal noise, not a reversal, and it is exactly the kind of figure that gets over-interpreted when quoted alone.
The rate is impressive, and the position is not yet secured. Claude finished roughly 879.2 million visits ahead over the same window and DeepSeek reached 3.8 billion, so Grok is closing the distance quickly without having closed it.
#8. Perplexity
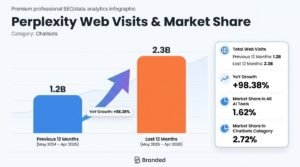
Key Data:
- Category: Chatbots
- Total Web Visits (may 2025 – apr 2026): 2.3B
- Total Web Visits (may 2024 – apr 2025): 1.2B
- Market Share in All AI Tools: 1.62%
- Market Share in Chatbots Category: 2.72%
- YoY Growth: +98.38%
Perplexity introduces a third growth shape into the chatbot group. It reached 2.3 billion visits over the latest twelve months, close to double the 1.2 billion it recorded the year before.
That gain of 1.16 billion visits sits just under the 1.21 billion Microsoft Copilot generated in total across the entire latest period, which puts the scale of a single year’s growth into perspective.
The monthly series tells a story the annual figure hides completely. Visits climbed from 55.9 million in May 2024 to a record 276.5 million in October 2025, then reversed. November fell to 240.0 million, February 2026 dropped to 179.3 million, March recovered briefly, and April closed at 170.7 million.
So Perplexity finished the year up 98.38% while ending roughly 38% below its own peak. Both statements are accurate, and only one of them appears in a growth ranking.
That makes this the clearest example in the study of why peak position matters alongside annual totals. Gemini, Claude, and Grok all ended near their highs. Perplexity’s strongest months came early, so its next phase depends on converting a genuine position in AI-first research into a second climb rather than living off gains already booked.
#9. Magnific (formerly FreePik)
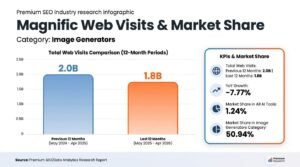
Key Data:
- Category: Image Generators
- Total Web Visits (may 2025 – apr 2026): 1.8B
- Total Web Visits (may 2024 – apr 2025): 2.0B
- Market Share in Total AI Tools: 1.24%
- Market Share in the Image Generators Category: 50.94%
- YoY Growth: -7.77%
Stepping outside chatbots changes the picture again. Magnific (formerly FreePik) recorded 1.8 billion visits from May 2025 to April 2026, making it the most-visited AI image generator in the study even after shedding 151.6 million visits.
Its category share tells the important half of the story. More than half of every image generator visit we tracked, 50.94%, went to this one tool while its own traffic fell 7.77%.
The monthly pattern was flat rather than falling away. Visits mostly held between 132.8 million and 173.0 million across the latest twelve months, against an average near 162.6 million a month the year before. The annual decline came from a slightly lower plateau, not from any collapse.
Underneath the leader, the category is behaving very differently. SeaArt.ai, the next largest image generator, recorded 292.7 million visits, meaning Magnific (formerly FreePik) still produced more than six times its nearest rival.
That combination of a shrinking leader and growing challengers is the clearest sign of a category still deciding what it wants. SeaArt.ai, PhotoRoom, Midjourney, and several others all gained visits over the same window while the leader edged backwards.
#10. Character AI
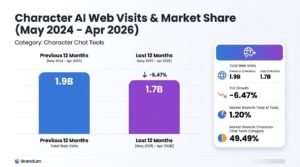
Key Data:
- Category: Character Chat Tools
- Total Web Visits (may 2025 – apr 2026): 1.7B
- Total Web Visits (may 2024 – apr 2025): 1.9B
- Market Share in Total AI Tools: 1.20%
- Market Share in Character Chat Tools Category: 49.49%
- YoY Growth: -6.47%
Character chat tools bring a two-horse market into view. Character AI held first place with 1.7 billion visits and 49.26% of all category traffic, while losing 119.8 million visits year over year as JanitorAI moved hard in the other direction.
Even in decline the dominance is striking. Nearly one in every two visits across the whole category still went to Character AI after a 6.47% drop.
The monthly data shows nothing resembling a collapse. Visits mostly moved between 119.7 million and 167.7 million through the latest year before reaching a 24-month high of 194.6 million in March 2026. That late surge protected first place without repairing the full-year total.
What changed most was the shape of the category rather than the leader’s numbers. Character AI and JanitorAI together now account for 93.98% of all character chat visits, leaving eight other tools to share what remains.
A comfortable lead has become a genuine contest. JanitorAI’s 53.14% growth closed most of the distance in a single year, which makes the March record more of a defence than a recovery.
#11. Janitor AI
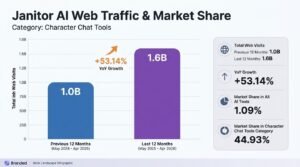
Key Data:
- Category: Character Chat Tools
- Total Web Visits (may 2025 – apr 2026): 1.6B
- Total Web Visits (may 2024 – apr 2025): 1.0B
- Market Share in Total AI Tools: 1.09%
- Market Share in Character Chat Tools Category: 44.93%
- YoY Growth: +53.14%
The challenger behind that shift sits immediately below it in the ranking. JanitorAI recorded 1.6 billion visits over the latest twelve months against 1.0 billion the year before, adding 545.6 million.
The monthly progression is the part worth noting. Visits climbed from 51.3 million in May 2024 to 141.2 million in April 2026, close to 2.8 times higher, with a March 2026 high of 149.0 million.
That growth arrived in increments rather than jumps. Several months in the latest period cleared 130 million, and no single month carried a disproportionate share of the annual gain, which is the profile of accumulating habit rather than a burst of attention.
Compare that against DeepSeek’s two-month explosion and the difference becomes clear. Steady accumulation is harder to start and considerably harder to reverse.
The category is now effectively a duopoly, with the two tools holding 93.98% of all visits between them. Character AI keeps the lead, and a gap that once looked settled has narrowed to a margin either tool could close.
#12. Microsoft Copilot
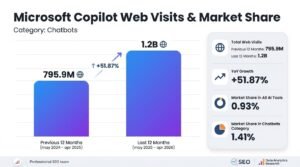
Key Data:
- Category: Chatbots
- Total Web Visits (may 2025 – apr 2026): 1.2B
- Total Web Visits (may 2024 – apr 2025): 795.9M
- Market Share in Chatbots Category: 1.41%
- Top 100 Market Share: 0.93%
- YoY Growth: +51.87%
Copilot returns us to chatbots through a different door. It generated 1.2 billion visits from May 2025 to April 2026, up from 795.9 million, adding 412.8 million, a 51.87% increase.
The most revealing figure is the floor rather than the ceiling. Copilot’s weakest month in the latest period still produced 81.3 million visits, against a low of 30.0 million during the previous year.
Across the latest twelve months, visits generally held between 81 million and 120 million, peaking at 120.0 million in March 2026. No individual month accounts for much of the annual gain. The whole band simply lifted and stayed lifted.
That is a very different growth signature from the breakout tools above it, and arguably a more stable one. Raising the floor is harder to reverse than setting a record.
It also fits how people meet the product. Copilot is positioned around workplace tasks inside Microsoft’s existing software, so a large share of its real use never generates a web visit at all. What the visit data captures is likely the smaller, more visible portion of a broader base.
#13. remove.bg
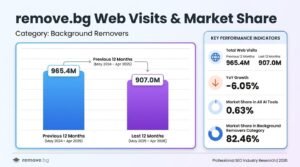
Key Data:
- Category: Background Removers
- Total Web Visits (may 2025 – apr 2026): 907.0M
- Total Web Visits (may 2024 – apr 2025): 965.4M
- Market Share in All AI Tools: 0.63%
- Market Share in Background Removers Category: 82.46%
- YoY Growth: -6.05%
After a run of broad, multi-purpose products, this entry does exactly one thing. Remove.bg strips backgrounds out of images, and that single function still produced 907.0 million visits over the latest twelve months.
Its grip on the category held firm through the decline. Remove.bg kept 82.46% of all background remover visits while its own total fell 6.05%.
The monthly range shows how gentle that slide was. The tool ran between 71.2 million and 90.5 million visits a month in the earlier year and between 67.3 million and 82.8 million in the latest one. The band shifted down slightly and stayed remarkably steady inside it.
That stability is the finding here. A tool with one function, no conversational interface, and no workflow beyond a single click lost 58.4 million annual visits and faced no credible challenge to its lead.
The lesson cuts against the broader unbundling trend in this study. When a task is genuinely atomic and the tool becomes synonymous with it, that association holds far longer than the category’s economics suggest it should, even as larger creative suites absorb the same capability.
#14. Salesforce
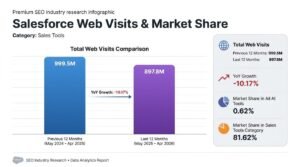
Key Data:
- Category: Sales Tools
- Total Web Visits (may 2025 – apr 2026): 897.8M
- Total Web Visits (may 2024 – apr 2025): 999.5M
- Market Share in All AI Tools: 0.62%
- Market Share in Sales Tools Category: 81.62%
- YoY Growth: -10.17%
Another category leader in decline follows, and this one carries a large caveat. Salesforce recorded 897.8 million visits over the latest twelve months against 999.5 million the year before, a loss of 101.6 million.
For scale, that annual loss exceeds Salesforce’s traffic in any single month across the entire 24-month window.
The monthly data points to a consistent softening rather than a shock. Visits stayed between 68.8 million and 83.2 million through the latest period, and not one month beat its counterpart from the year before. A uniform year-on-year shortfall like that is a level change, not volatility.
Category leadership never came under threat. Salesforce held 83.66% of Sales Tools visits throughout, which means no rival gained what it lost.
The caveat matters more here than almost anywhere else in this study. Enterprise software runs largely behind logins, inside team accounts, and through contracted deployments that never touch a public page. Falling public visits tell us about discovery behaviour and tell us very little about whether the platform is being used more or less.
#15. Suno
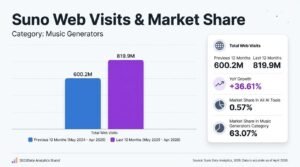
Key Data:
- Category: Music Generators
- Total Web Visits (may 2025 – apr 2026): 819.9M
- Total Web Visits (may 2024 – apr 2025): 600.2M
- Market Share in All AI Tools: 0.57%
- Market Share in Music Generators Category: 63.07%
- YoY Growth: +36.61%
Two declining leaders give way to a tool moving firmly upward. Suno drew 819.9 million visits from May 2025 to April 2026, adding 219.7 million on the previous year.
The annual growth rate understates what happened. Suno produced 505.1 million visits in the final six months of the period against 314.8 million in the first six, a gap of 60.5% between the two halves.
The monthly detail explains that split. Suno held near 46 to 52 million visits a month from May through September 2025, then climbed to 67.8 million in October, cleared 80 million in November, and set a 24-month high of 92.1 million in March 2026.
April closed at 87.5 million, roughly 88% above the 46.5 million recorded in April 2025. The tool did not spike and fall back. It relocated to a materially higher band and stayed there.
That is why a 36.61% headline growth figure is the least interesting number in this profile. Averaged across twelve months, it blends a flat first half with a sharply rising second half into a single figure that describes neither.
#16. Quizlet
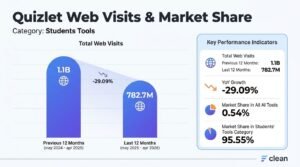
Key Data:
- Category: Students Tools
- Total Web Visits (may 2025 – apr 2026): 782.7M
- Total Web Visits (may 2024 – apr 2025): 1.1B
- Market Share in All AI Tools: 0.54%
- Market Share in Students’ Tools Category: 95.55%
- YoY Growth: -29.09%
Suno gained momentum through the year. Quizlet lost it in almost exactly the same window. The study tool recorded 782.7 million visits from May 2025 to April 2026 against 1.1 billion the year before, giving up 321.1 million.
The seasonal comparison is the sharpest illustration. Quizlet’s February peak fell from 130.4 million visits in 2025 to 65.2 million in 2026, almost precisely half.
Every single month in the latest period came in below its counterpart a year earlier. The familiar academic rhythm still appeared around September, October, and the new year, and each of those seasonal lifts arrived weaker than the one before.
No competitor absorbed the difference. Quizlet still held 95.55% of Students’ Tools visits, so this was not one study platform losing to another.
The decline instead belongs to a broader movement affecting student, academic writing, and translation tools together. A general assistant that explains a concept, builds practice questions, condenses notes, and handles follow-ups in one conversation removes several reasons to open a dedicated study site, and this dataset cannot follow those visits to confirm where they landed.
#17. Qualtrics
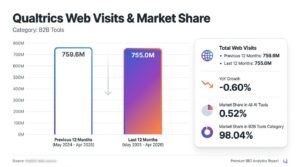
Key Data:
- Category: B2B Tools
- Total Web Visits (may 2025 – apr 2026): 755.0M
- Total Web Visits (may 2024 – apr 2025): 759.6M
- Market Share in All AI Tools: 0.52%
- Market Share in B2B Tools Category: 98.04%
- YoY Growth: -0.60%
After a steep fall, the most stable result in the Top 20 provides a useful contrast. Qualtrics recorded 755.0 million visits from May 2025 to April 2026, just 4.6 million below the 759.6 million logged the year before.
That is the smallest year-over-year movement of any tool in the top twenty. Every other entry shifted by at least 6% in one direction or the other. Qualtrics moved 0.60%.
Its monthly figures were not flat. Visits ranged from 50.1 million to 73.2 million across the latest period, and the rises and falls simply cancelled each other out over twelve months.
What makes that notable is the environment around it. Chatbots surged, study tools contracted, translators shed more than a fifth of their traffic, and Qualtrics registered none of it essentially.
The insulation looks structural. Qualtrics holds 98.04% of B2B Tools visits and serves an established research and experience-management use case that general assistants have not yet moved into, which makes its lack of movement more informative than most of the growth figures in this ranking.
#18. Grammarly
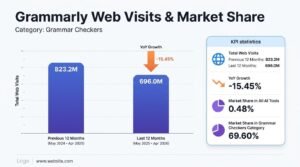
Key Data:
- Category: Grammar Checkers
- Total Web Visits (may 2025 – apr 2026): 696.0M
- Total Web Visits (may 2024 – apr 2025): 823.2M
- Market Share in All AI Tools: 0.48%
- Market Share in Grammar Checkers Category: 69.60%
- YoY Growth: -15.45%
From near-total stability, we return to steady erosion. Grammarly recorded 696.0 million visits from May 2025 to April 2026 against 823.2 million a year earlier, a loss of 127.2 million.
The underlying shift shows in the averages. Monthly visits fell from 68.6 million to 58.0 million, and every month in the latest period finished below its equivalent from the year before.
The line was not uniformly downward. Visits recovered from one month to the next on several occasions, reaching 65.9 million in October 2025 and 65.1 million in March 2026, and neither figure matched the levels Grammarly held routinely a year earlier.
Category position remained intact throughout. Grammarly still took 69.60% of all Grammar Checker visits, so no standalone rival is responsible for the shortfall.
The likelier cause is that grammar checking stopped being a destination. Correction and rewriting now sit inside chatbots, document editors, browsers, and email clients, which turns a dedicated visit into an optional one for a large share of everyday writing tasks.
#19. DeepL Translate
Key Data:
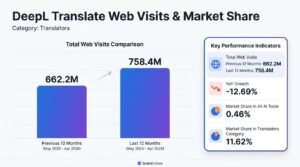
- Category: Translators
- Total Web Visits (may 2025 – apr 2026): 662.2M
- Total Web Visits (may 2024 – apr 2025): 758.4M
- Market Share in All AI Tools: 0.46%
- Market Share in Translators Category: 11.62%
- YoY Growth: -12.69%
Grammarly’s decline leads directly to another language tool on the same trajectory. DeepL recorded 662.2 million visits from May 2025 to April 2026 against 758.4 million the year before, down 96.2 million or 12.69%.
The annual figure conceals a much steeper slide. DeepL produced 376.4 million visits in the first six months of the latest period and only 285.8 million in the final six, a drop of 24.1% between halves.
The 24-month view sets that in context. DeepL rose from 26.6 million visits in May 2024 to a peak of 79.9 million in January 2025, then reversed. Monthly visits fell below 50 million in four of the last six months and closed at 44.4 million in April 2026, roughly 44.5% under the peak.
Read alongside Google Translate, the pattern stops looking company-specific. Both of the largest translators lost traffic across the same window, one from a colossal base and one from a modest one.
That symmetry is what makes translation the clearest case study in this report. The work has not reduced. The number of occasions on which that work requires its own website has.
#20. QuillBot
Key Data:
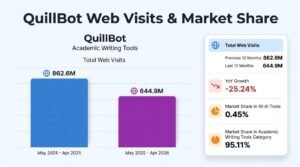
- Category: Academic Writing Tools
- Total Web Visits (may 2025 – apr 2026): 644.9M
- Total Web Visits (may 2024 – apr 2025): 862.6M
- Market Share in All AI Tools: 0.45%
- Market Share in Academic Writing Tools Category: 95.11%
- YoY Growth: -25.24%
The final entry in the Top 20 repeats the translation pattern inside academic writing. QuillBot recorded 644.9 million visits from May 2025 to April 2026 against 862.6 million the year before.
The 217.7 million visits lost make this the third-largest absolute decline in the top twenty, and every month in the latest period landed below its counterpart from a year earlier.
The slope was gradual rather than sudden. QuillBot opened the 24-month window at 93.2 million visits in May 2024 and closed it at 51.2 million in April 2026, a fall of roughly 45% between those two months. Even its best recent month, 66.0 million in October 2025, sat below the 81.7 million it managed in October 2024.
Its category grip barely moved. QuillBot still held 95.11% of Academic Writing Tools visits, so no specialist rival took its place.
The use case itself appears to be relocating. Paraphrasing, rewriting, summarising, and the follow-up questions that surround them now happen in the same conversation as the rest of a student’s work, which removes the tab switch that used to generate the visit.
Which AI Tool Categories Are Leading User Demand in 2026?
(may 2025 – apr 2026)
Individual tools show us where attention landed. Grouping those tools by category shows us why it landed there, and the picture changes noticeably once the twenty deep dives are set aside.
Categories grow for three different reasons in this dataset, and they are not interchangeable. Some rise because one dominant tool pulls the entire group upward. Others expand across several competitors at once. A third group stays large while losing visits as its core task migrates into broader products.
The visual below compares the ten largest categories by total visits from May 2025 to April 2026, which makes the distance between chatbots and everything else immediately obvious.
The imbalance is severe. Chatbots produced 86.0 billion visits, grew 90.82% year over year, and took a 59.49% share of all AI tool traffic. That single category attracted more than 2.6 times the combined visits of the other nine in the Top 10.
Below that, the drop is steep. Design Generators placed second with 10.9 billion visits and Translators third with 5.7 billion, and the two moved in opposite directions. Design Generators grew 12.87% while Translators lost 1.6 billion visits at a 22.52% decline.
That divergence between second and third place explains a great deal about how AI use is reorganising. Design capability is being added to tools people already open for presentations, images, and creative work, which keeps the visit inside the category. Translation capability is being added to tools that sit outside the translation category entirely, which removes the visit from it.
Further down, several quieter movements matter. Video Generators posted the strongest growth outside chatbots at 31.24%, reaching 2.6 billion visits, while Music Generators grew 21.22% to 1.3 billion. Image Generators were essentially static at 3.5 billion, up just 0.19%.
Project Management Tools show a different structure again. We tracked 285 tools in that category, more than any other in the Top 10, and together they produced only 2.6 billion visits. Wide participation with modest total traffic is the signature of a fragmented market where no default has formed.
Character Chat Tools invert that shape completely. The category generated 3.5 billion visits with almost all of them flowing to two tools. One category spreads visits across hundreds of competitors, the other concentrates them into a pair.
Background Removers and Sales Tools both moved backwards, falling 5.13% and 9.15%. In each case a single tool holds most of the category, so its decline dragged the entire group down regardless of what the challengers did.
The takeaway is that category totals need structural context to mean anything. Two categories can post identical growth while one is broadening across many competitors and the other is riding a single leader, and those two futures look nothing alike.
The full table below assembles every figure discussed here. It ranks the ten most-visited categories by total visits from May 2025 to April 2026, alongside the number of tools tracked, both twelve-month totals, absolute change, year-over-year growth, and market share.
Top 10 Most Popular AI Tool Categories by Total Web Visits in the Last 12 Months (may 2025 – apr 2026)
| Rank | Category | Number of Tools | Total Web Visits of 12 Months(may 2024–apr 2025) | Total Web Visits of Last 12 Months(may 2025–apr 2026) | Change | Change (%) | Market Share (%) |
|---|---|---|---|---|---|---|---|
| 1 | Chatbots | 231 | 45.1B | 86.0B | 40.9B | 90.82% | 59.49% |
| 2 | Design Generators | 216 | 9.6B | 10.9B | 1.2B | 12.87% | 7.52% |
| 3 | Translators | 59 | 7.3B | 5.7B | -1.6B | -22.52% | 3.92% |
| 4 | Image Generators | 191 | 3.5B | 3.5B | 6.7M | 0.19% | 2.44% |
| 5 | Character Chat Tools | 114 | 3.1B | 3.5B | 410.2M | 13.20% | 2.43% |
| 6 | Project Management Tools | 285 | 2.2B | 2.6B | 402.1M | 18.55% | 1.78% |
| 7 | Video Generators | 199 | 2.0B | 2.6B | 609.6M | 31.24% | 1.77% |
| 8 | Music Generators | 124 | 1.0B | 1.3B | 222.7M | 21.22% | 0.88% |
| 9 | Background Removers | 51 | 1.2B | 1.1B | -60.8M | -5.13% | 0.78% |
| 10 | Sales Tools | 161 | 1.2B | 1.1B | -108.1M | -9.15% | 0.74% |
Category Concentration Ratios: Which AI Markets Are Still Open
Reading ten category sections in sequence makes it hard to compare their competitive structures directly. Pulling the leader-share figures into one table solves that, and it exposes a split the individual sections cannot show.
| Category | Category visits | Leader | Leader share | Top 2 share | Market structure |
| Chatbots | 86.0B | ChatGPT | 75.22% | 80.53% | Dominated, growing challengers |
| Design Generators | 10.9B | Canva | 96.28% | 97.16% | Effectively closed |
| Translators | 5.7B | Google Translate | 84.27% | 95.97% | Closed and contracting |
| Image Generators | 3.5B | Magnific (formerly FreePik) | 50.94% | 59.31% | Contested |
| Character Chat Tools | 3.5B | Character AI | 49.26% | 93.98% | Duopoly |
| Video Generators | 2.6B | Higgsfield AI | 12.13% | 21.83% | Wide open |
| Project Management Tools | 2.6B | ClickUp | 20.49% | 40.06% | Fragmented |
| Music Generators | 1.3B | Suno | 63.07% | 82.51% | Consolidating |
| Background Removers | 1.1B | remove.bg | 80.72% | 86.96% | Closed, leader declining |
| Sales Tools | 1.1B | Salesforce | 83.66% | 89.70% | Closed, leader declining |
Six of the ten categories have a leader holding more than 60% of visits. In those markets a new entrant is not competing for share so much as competing for the leftover fifth, which is a fundamentally different commercial proposition.
Two categories are genuinely open. Video Generators and Project Management Tools both have leaders under 21%, and both are growing, at 31.24% and 18.55% respectively. Growth plus low concentration is the only combination in this table that describes an unsettled market.
Image Generators sit in the middle and are moving. A 50.94% leader share with a declining leader and seven of ten challengers gaining is a category actively redistributing.
The most instructive pairing is Design Generators against Video Generators. Both are creative categories, both grew, and one has a 96.28% leader while the other’s leader holds 12.13%. Category maturity, not category type, determines how open a market is.
Three categories combine high concentration with a falling leader: Translators, Background Removers, and Sales Tools. That combination is worth watching closely, because a dominant tool losing traffic in a shrinking category rarely signals a challenger’s opportunity. It usually signals the task leaving the category altogether.
1. Top 10 AI Chatbots By Total Web Visits in the Last 12 Months (may 2025 – apr 2026)
We already know chatbots take more than half of all AI tool visits. Looking inside the category shows the concentration running deeper still.
The ten tools below account for roughly 85.6 billion of the category’s 86.0 billion visits. Almost nothing in this category happens outside its top ten.
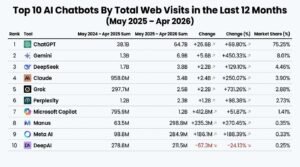
The visual ranks those ten by total visits from May 2025 to April 2026, with each compared against the previous twelve months so the growth and slowdown patterns are visible side by side.
ChatGPT anchors everything. Its 64.7 billion visits exceed the roughly 20.9 billion produced by the other nine combined, which is why the category’s share of the overall market tracks so closely to one tool’s performance.
The growth, though, was genuinely distributed. Gemini added 5.6 billion visits, Claude added 2.4 billion, and Grok added 2.2 billion. Manus grew 370.45% and overtook longer-established names including DeepAI.
Nine of the ten largest chatbots gained visits year over year. DeepAI was the sole decline at 24.13%.
That distinction between concentration and competition is the key reading. ChatGPT owns most of the category, and almost every tool inside it is growing, which makes chatbots simultaneously the most dominated and one of the most actively contested categories in the study.
The full table below sets out how each of the top ten performed across total visits, year-over-year change, and category market share.
Top 10 AI Chatbots By Total Web Visits in the Last 12 Months (may 2025 – apr 2026)
| Rank | Tool Name | URL | Category | may 2024 – apr 2025Sum | may 2025–apr 2026Sum | Change | Change (%) | Market Share (%) |
|---|---|---|---|---|---|---|---|---|
| 1 | ChatGPT | https://chatgpt.com/ | Chatbots | 38.1B | 64.7B | 26.6B | 69.80% | 75.25% |
| 2 | Gemini | https://gemini.google.com | Chatbots | 1.3B | 6.9B | 5.6B | 450.33% | 8.01% |
| 3 | DeepSeek | https://www.deepseek.com/ | Chatbots | 1.7B | 3.8B | 2.2B | 129.10% | 4.46% |
| 4 | Claude | https://claude.ai | Chatbots | 958.0M | 3.4B | 2.4B | 250.07% | 3.90% |
| 5 | Grok | https://grok.com/ | Chatbots | 297.7M | 2.5B | 2.2B | 731.26% | 2.88% |
| 6 | Perplexity | https://www.perplexity.ai/ | Chatbots | 1.2B | 2.3B | 1.2B | 98.38% | 2.73% |
| 7 | Microsoft Copilot | https://copilot.microsoft.com/ | Chatbots | 795.9M | 1.2B | 412.8M | 51.87% | 1.41% |
| 8 | Manus | https://manus.im/ | Chatbots | 63.5M | 298.8M | 235.3M | 370.45% | 0.35% |
| 9 | Meta AI | https://www.meta.ai/ | Chatbots | 98.8M | 284.9M | 186.1M | 188.39% | 0.33% |
| 10 | DeepAI | https://deepai.org/ | Chatbots | 278.8M | 211.5M | -67.3M | -24.13% | 0.25% |
2. Top 10 AI Design Generators By Total Web Visits in the Last 12 Months (may 2025 – apr 2026)
Chatbots concentrate around one leader with active challengers. Design Generators concentrate around one leader with almost nothing behind it.
The visual ranks the ten most-visited design generators from May 2025 to April 2026 against their previous twelve months, which makes the distribution inside the category unusually stark.
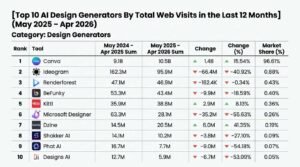
Canva took 10.5 billion visits and 96.28% of all category traffic. The remaining nine tools in the top ten produced roughly 297.4 million between them.
Expressed as a ratio, Canva attracted more than 35 times the combined visits of the other nine tools in its own top ten.
There is no meaningful second place. Ideogram ranked next at 95.9 million visits and fell 40.92% year over year. Renderforest and BeFunky followed at 46.9 million and 43.4 million, both flat or declining.
Only three tools in the top ten grew at all. Canva rose 15.54%, Dzine gained 41.35%, and Kittl added 8.13%, while Microsoft Designer, Phot AI, and Designs AI each lost more than half their prior-year visits.
That produces a large category that is not competitive at the top in any practical sense. Canva has stopped being one option among several and has become the default destination, leaving the rest of the field competing for a share of the residual 3.72%.
The table below shows the full extent of that gap across total visits, year-over-year change, and category market share.
Top 10 AI Design Generators by Total Web Visits in the Last 12 Months (may 2025 – apr 2026)
| Rank | Tool Name | URL | Category | may 2024–apr 2025Sum | may 2025–apr 2026Sum | Change | Change (%) | Market Share (%) |
|---|---|---|---|---|---|---|---|---|
| 1 | Canva | https://www.canva.com/ | Design Generators | 9.1B | 10.5B | 1.4B | 15.54% | 96.61% |
| 2 | Ideogram | https://ideogram.ai/ | Design Generators | 162.3M | 95.9M | -66.4M | -40.92% | 0.88% |
| 3 | Renderforest | https://www.renderforest.com/ | Design Generators | 47.1M | 46.9M | -162.4K | -0.34% | 0.43% |
| 4 | BeFunky | https://www.befunky.com/ | Design Generators | 53.3M | 43.4M | -9.9M | -18.59% | 0.40% |
| 5 | Kittl | https://www.kittl.com/ | Design Generators | 35.9M | 38.8M | 2.9M | 8.13% | 0.36% |
| 6 | Microsoft Designer | https://designer.microsoft.com/ | Design Generators | 63.3M | 28.1M | -35.2M | -55.63% | 0.26% |
| 7 | Dzine | https://www.dzine.ai/ | Design Generators | 14.5M | 20.5M | 6.0M | 41.35% | 0.19% |
| 8 | Shakker AI | https://www.shakker.ai/ | Design Generators | 14.1M | 10.2M | -3.8M | -27.10% | 0.09% |
| 9 | Phot AI | https://www.phot.ai/ | Design Generators | 16.7M | 7.7M | -9.0M | -54.18% | 0.07% |
| 10 | Designs AI | https://designs.ai/ | Design Generators | 12.7M | 5.9M | -6.7M | -53.09% | 0.05% |
3. Top 10 AI Translators by Total Web Visits in the Last 12 Months (may 2025 – apr 2026)
Canva showed what concentration looks like when the leader is growing. Translators show what it looks like when the leader is not, and the category is even more concentrated.
The visual ranks the ten most-visited translators from May 2025 to April 2026 against the previous twelve months, which answers the question that matters here: is one large tool struggling, or is the whole category contracting?
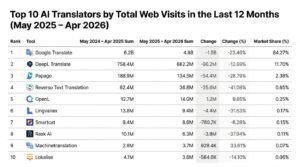
Google Translate held 4.8 billion visits and an 84.27% category share. DeepL followed at 662.2 million and 11.70%, putting nearly 96% of all category traffic in two products. Both declined: Google Translate by 1.46 billion visits and DeepL by 96.2 million.
The imbalance in the exceptions settles the question. Eight of the ten largest translators lost visits, and the two that grew, OpenL and MachineTranslation.com, added roughly 2.1 million between them against Google Translate’s 1.46 billion loss.
The rest of the ranking moves the same way. Papago fell 28.79%, Reverso dropped 41.08%, Lingvanex lost 31.63%, and Rask AI declined 37.94%. Across the whole category, visits fell 1.6 billion, down 22.52%.
So this is not competitive displacement. Nearly every tool in the category lost ground at once, which only happens when demand leaves the category rather than moving inside it.
Translation itself has not become less useful. Users can now translate, rewrite, summarise, and ask follow-up questions inside general assistants without opening a dedicated tool, which removes the visit while leaving the task intact.
The table below shows how broadly that decline spread across total visits, year-over-year change, and category market share.
Top 10 AI Translators by Total Web Visits in the Last 12 Months (may 2025 – apr 2026)
| Rank | Tool Name | URL | Category | may 2024–apr 2025Sum | may 2025–apr 2026Sum | Change | Change (%) | Market Share (%) |
|---|---|---|---|---|---|---|---|---|
| 1 | Google Translate | https://translate.google.com | Translators | 6.2B | 4.8B | –1.5B | -23.46% | 84.27% |
| 2 | DeepL Translate | https://www.deepl.com/en/translator | Translators | 758.4M | 662.2M | –96.2M | -12.69% | 11.70% |
| 3 | Papago | https://papago.naver.com/ | Translators | 188.9M | 134.5M | –54.4M | -28.79% | 2.38% |
| 4 | Reverso Text Translation | https://www.reverso.net/text-translation | Translators | 62.4M | 36.8M | –25.6M | -41.08% | 0.65% |
| 5 | OpenL | https://openl.io/ | Translators | 12.7M | 14.0M | 1.2M | 9.65% | 0.25% |
| 6 | Lingvanex | https://lingvanex.com/ | Translators | 13.8M | 9.4M | –4.4M | -31.63% | 0.17% |
| 7 | Smartcat | https://www.smartcat.com/ | Translators | 9.4M | 8.6M | –780.7K | -8.28% | 0.15% |
| 8 | Rask AI | https://www.rask.ai/ | Translators | 10.1M | 6.3M | –3.8M | -37.94% | 0.11% |
| 9 | Machinetranslation | https://www.machinetranslation.com/ | Translators | 2.8M | 3.7M | 929.4K | 33.61% | 0.07% |
| 10 | Lokalise | https://lokalise.com/ | Translators | 4.1M | 3.6M | –584.6K | -14.10% | 0.06% |
4. Top 10 AI Image Generator Tools by Total Web Visits in the Last 12 Months (may 2025 – apr 2026)
Translators contracted almost uniformly. Image generators did the opposite, producing one of the most mixed sets of results in the study, with the leader falling while most challengers climbed.
The visual ranks the ten most-visited image generators from May 2025 to April 2026 against the previous twelve months, which shows whether growth is staying with the established names or migrating.
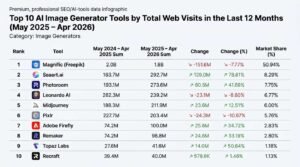
Magnific (formerly FreePik) led with 1.8 billion visits and a 50.94% share, while losing 151.6 million visits at a 7.77% decline. Unlike Canva in design, it faces several rivals with substantial audiences of their own.
The direction of new demand is unambiguous. Seven of the top ten gained visits, with SeaArt.ai and Photoroom adding 209.5 million between them while the leader gave up 151.6 million.
SeaArt.ai grew fastest among the larger tools, rising 78.81% to 292.7 million visits. Photoroom reached 273.6 million on 41.69% growth, and Adobe Firefly, Remaker, Topaz Labs, and Midjourney all finished above their prior-year totals.
Not everything rose. Leonardo AI fell 8.80% and Pixlr declined 10.67%, which makes this a category where growth is real and unevenly distributed rather than broadly shared.
The practical reading is that image generation remains an open market. Magnific (formerly FreePik) holds the lead without extending it, several challengers are gaining simultaneously, and users are still distributing visits across tools built for different styles, workflows, and degrees of creative control.
The table below shows how that competition is developing across total visits, year-over-year change, and category market share.
Top 10 AI Image Generator Tools by Total Web Visits in the Last 12 Months (may 2025 – apr 2026)
| Rank | Tool Name | URL | Category | may 2024–apr 2025Sum | may 2025–apr 2026Sum | Change | Change (%) | Market Share (%) |
|---|---|---|---|---|---|---|---|---|
| 1 | Magnific (Freepik) | https://www.magnific.com/ | Image Generators | 2.0B | 1.8B | -151.6M | -7.77% | 50.94% |
| 2 | Seaart.ai | https://seaart.ai/ | Image Generators | 163.7M | 292.7M | 129.0M | 78.81% | 8.29% |
| 3 | Photoroom | https://www.photoroom.com/ | Image Generators | 193.1M | 273.6M | 80.5M | 41.69% | 7.75% |
| 4 | Leonardo AI | https://leonardo.ai/ | Image Generators | 262.3M | 239.2M | -23.1M | -8.80% | 6.77% |
| 5 | Midjourney | https://www.midjourney.com/ | Image Generators | 188.3M | 211.9M | 23.6M | 12.51% | 6.00% |
| 6 | Pixlr | https://pixlr.com/ | Image Generators | 227.7M | 203.4M | -24.3M | -10.67% | 5.76% |
| 7 | Adobe Firefly | https://firefly.adobe.com/ | Image Generators | 74.2M | 100.0M | 25.8M | 34.72% | 2.83% |
| 8 | Remaker | https://remaker.ai/ | Image Generators | 74.2M | 98.8M | 24.6M | 33.19% | 2.80% |
| 9 | Topaz Labs | https://www.topazlabs.com/ | Image Generators | 27.6M | 41.6M | 14.0M | 50.64% | 1.18% |
| 10 | Recraft | https://recraft.ai/ | Image Generators | 39.4M | 40.0M | 576.9K | 1.46% | 1.13% |
5. Top 10 AI Character Chat Tools by Total Web Visits in the Last 12 Months (may 2025 – apr 2026)
Image generators spread visits across many competitors. Character chat tools compress them into two, which makes the category’s headline growth figure genuinely misleading.
The visual ranks the ten most-visited character chat tools from May 2025 to April 2026 against the previous twelve months. The category rose from 3.1 billion to 3.5 billion visits, up 13.20%, and that increase came from a much narrower base than the total suggests.
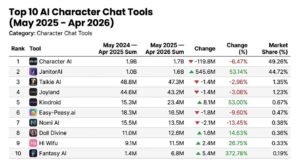
Character AI stayed largest at 1.7 billion visits while falling 6.47%. JanitorAI grew 53.14% to 1.6 billion. Together they took 93.98% of category traffic, leaving eight tools to divide just over 6%.
One tool accounts for more than the whole. JanitorAI added 545.6 million visits against a category net gain of 410.2 million, meaning the category would have lost roughly 135.4 million visits without it.
That reframes the growth entirely. Character AI, Talkie AI, Joyland, Easy-Peasy.ai, and Nomi AI all lost visits over the same window, so category expansion came from a single challenger closing on a single leader.
Lower down, Fantasy AI posted the fastest percentage growth in the category at 372.78% and reached only 6.8 million visits. Rapid growth from a small base signals early interest without shifting the balance of anything.
In practice the category is becoming more competitive at the top rather than more evenly spread. Character AI still leads, and a gap that once looked decisive has become a two-tool race with everything else on the periphery.
The table below shows how that shift played out across total visits, year-over-year change, and category market share.
Top 10 AI Character Chat Tools by Total Web Visits in the Last 12 Months (may 2025 – apr 2026)
| Rank | Tool Name | URL | Category | may 2024–apr 2025Sum | may 2025–apr 2026Sum | Change | Change (%) | Market Share (%) |
|---|---|---|---|---|---|---|---|---|
| 1 | Character AI | https://character.ai/ | Character Chat Tools | 1.9B | 1.7B | -119.8M | -6.47% | 49.26% |
| 2 | JanitorAI | https://janitorai.com/ | Character Chat Tools | 1.0B | 1.6B | 545.6M | 53.14% | 44.72% |
| 3 | Talkie AI | https://www.talkie-ai.com/ | Character Chat Tools | 48.8M | 47.3M | -1.4M | -2.96% | 1.35% |
| 4 | Joyland | https://www.joyland.ai/ | Character Chat Tools | 44.6M | 43.2M | -1.4M | -3.08% | 1.23% |
| 5 | Kindroid | https://kindroid.ai/ | Character Chat Tools | 15.3M | 23.4M | 8.1M | 53.00% | 0.67% |
| 6 | Easy-Peasy.ai | https://easy-peasy.ai/ | Character Chat Tools | 18.3M | 16.5M | -1.8M | -9.60% | 0.47% |
| 7 | Nomi AI | https://nomi.ai/ | Character Chat Tools | 15.5M | 13.5M | -2.1M | -13.45% | 0.38% |
| 8 | Doll Divine | https://www.dolldivine.com/ | Character Chat Tools | 11.0M | 12.6M | 1.6M | 14.63% | 0.36% |
| 9 | Hi Wifu | https://hiwaifu.com/ | Character Chat Tools | 9.1M | 11.5M | 2.4M | 26.75% | 0.33% |
| 10 | Fantasy AI | https://fantasy.ai/ | Character Chat Tools | 1.4M | 6.8M | 5.4M | 372.78% | 0.19% |
6. Top 10 AI Project Management Tools by Total Web Visits in the Last 12 Months (may 2025 – apr 2026)
Character chat tools compress into two names. Project management tools do the opposite, spreading visits across several products operating in the same range.
The visual ranks the ten most-visited project management tools from May 2025 to April 2026 against the previous twelve months. The category grew from 2.2 billion to 2.6 billion visits, up 18.55%, with the top ten contributing roughly 2.44 billion.
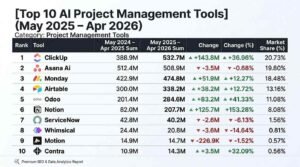
ClickUp took first place with 532.7 million visits, up 36.96%. Asana AI followed at 508.9 million, essentially flat with a 0.68% decline. Monday placed third at 474.8 million, and Airtable reached 338.2 million.
The margins at the top are almost negligible. Just 57.9 million visits separate ClickUp, Asana AI, and Monday, which together produced more than 1.5 billion visits without any single tool holding even a quarter of the category.
That is a completely different competitive shape from Design Generators, Translators, or Background Removers. Teams are not converging on one default. Their visits distribute across products that overlap heavily across tasks, collaboration, planning, documentation, and workflow automation.
The largest movement came from Notion, which climbed from 82.0 million to 207.7 million visits, a 153.28% increase and the fastest growth in the top ten. ClickUp added slightly more in absolute terms at 143.8 million, while Notion more than doubled its base.
The pattern suggests AI adoption here is happening inside workspaces teams already occupy. Rather than replacing project software with a new AI product, teams appear to be picking up AI features across several familiar tools at once, which is precisely why the category grows without producing a runaway leader.
The table below shows how that competition distributes across total visits, year-over-year change, and category market share.
Top 10 AI Project Management Tools by Total Web Visits in the Last 12 Months (may 2025 – apr 2026)
| Rank | Tool Name | URL | Category | may 2024–apr 2025Sum | may 2025–apr 2026Sum | Change | Change (%) | Market Share (%) |
|---|---|---|---|---|---|---|---|---|
| 1 | Clickup | https://clickup.com/ | Project Management Tools | 388.9M | 532.7M | 143.8M | 36.96% | 20.73% |
| 2 | Asana Ai | https://asana.com/ | Project Management Tools | 512.4M | 508.9M | -3.5M | -0.68% | 19.80% |
| 3 | Monday | https://monday.com/ | Project Management Tools | 422.9M | 474.8M | 51.9M | 12.27% | 18.48% |
| 4 | Airtable | https://airtable.com/ | Project Management Tools | 300.0M | 338.2M | 38.2M | 12.72% | 13.16% |
| 5 | Odoo | https://www.odoo.com/ | Project Management Tools | 201.4M | 284.6M | 83.2M | 41.33% | 11.08% |
| 6 | Notion | https://www.notion.com/ | Project Management Tools | 82.0M | 207.7M | 125.7M | 153.28% | 8.08% |
| 7 | Servicenow | https://www.servicenow.com/ | Project Management Tools | 42.8M | 40.2M | -2.6M | -6.13% | 1.56% |
| 8 | Whimsical | https://whimsical.com/ | Project Management Tools | 24.4M | 20.8M | -3.6M | -14.64% | 0.81% |
| 9 | Motion | https://www.usemotion.com/ | Project Management Tools | 14.9M | 14.7M | -226.9K | -1.52% | 0.57% |
| 10 | Contra | https://contra.com/ | Project Management Tools | 10.9M | 14.3M | 3.5M | 32.09% | 0.56% |
7. Top 10 AI Video Generators by Total Web Visits in the Last 12 Months (may 2025 – apr 2026)
Project management tools divide evenly among established names. Video generators divide even further, and the names doing the dividing changed inside a single year.
The visual ranks the ten most-visited video generators from May 2025 to April 2026 against the previous twelve months. The category grew from 2.0 billion to 2.6 billion visits, adding 609.6 million at 31.24% growth.
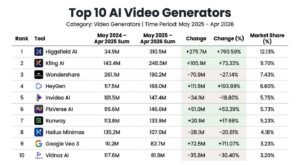
Higgsfield AI took first place with 310.5 million visits, up from 34.9 million the year before, and its 790.59% growth was the fastest in the category. Kling AI followed at 248.5 million and Wondershare at 190.2 million despite losing 27.14% of its prior-year traffic.
The leader’s position is remarkably thin. Higgsfield AI added 275.7 million visits, roughly 45% of the entire category’s year-over-year gain, and still holds only 12.13% of category traffic.
That combination defines this category. It is growing quickly, no default has emerged, nearly 88% of visits go somewhere other than the leader, and the top ten’s 1.62 billion visits leave a meaningful remainder spread across the other 189 video tools we tracked.
Movement below first place was equally sharp. HeyGen almost tripled, growing 193.99% to 169.0 million, while Google Veo 3 rose 711.07% to 82.7 million. Kling AI gained 73.33% and PixVerse AI 53.39%, while Wondershare, InVideo AI, Hailuo Minimax, and Vidnoz AI all fell.
People are clearly still working out where AI video belongs in their process. A new release can redirect visits within weeks, an established name can lose a quarter of its traffic in a year, and that volatility makes video one of the fastest-growing and least settled categories in the study.
The table below shows how quickly the ranking is moving across total visits, year-over-year change, and category market share.
Top 10 AI Video Generators by Total Web Visits in the Last 12 Months (may 2025 – apr 2026)
| Rank | Tool Name | URL | Category | may 2024–apr 2025Sum | may 2025–apr 2026Sum | Change | Change (%) | Market Share (%) |
|---|---|---|---|---|---|---|---|---|
| 1 | Higgsfield AI | https://higgsfield.ai/ | Video Generators | 34.9M | 310.5M | 275.7M | 790.59% | 12.13% |
| 2 | Kling AI | https://klingai.com/global/?ref=aitools&utm_source=aitools&utm_medium=referral | Video Generators | 143.4M | 248.5M | 105.1M | 73.33% | 9.70% |
| 3 | Wondershare | https://www.wondershare.com/ | Video Generators | 261.1M | 190.2M | -70.9M | -27.14% | 7.43% |
| 4 | HeyGen | https://www.heygen.com/ | Video Generators | 57.5M | 169.0M | 111.5M | 193.99% | 6.60% |
| 5 | Invideo AI | https://invideo.io/ | Video Generators | 181.5M | 147.4M | -34.1M | -18.80% | 5.75% |
| 6 | PixVerse AI | https://pixverse.ai/ | Video Generators | 95.6M | 146.6M | 51.0M | 53.39% | 5.73% |
| 7 | Runway | https://runwayml.com/ | Video Generators | 113.8M | 133.9M | 20.1M | 17.69% | 5.23% |
| 8 | Hailuo Minimax | https://hailuoai.video/ | Video Generators | 135.2M | 107.0M | -28.1M | -20.81% | 4.18% |
| 9 | Google Veo 3 | https://gemini.google/overview/video-generation/ | Video Generators | 10.2M | 82.7M | 72.5M | 711.07% | 3.23% |
| 10 | Vidnoz AI | https://www.vidnoz.com/ | Video Generators | 117.6M | 81.8M | -35.8M | -30.40% | 3.20% |
8. Top 10 AI Music Generator Tools by Total Web Visits in the Last 12 Months (may 2025 – apr 2026)
Video generators are still unsettled. Music generators have already begun to settle, with most visits gathering around two tools that both grew.
The visual ranks the ten most-visited music generators from May 2025 to April 2026 against the previous year. Across the category, visits rose from 1.0 billion to 1.3 billion, up 21.22%.
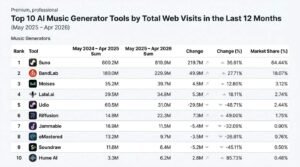
Suno held first place with 819.9 million visits on 36.61%. BandLab followed at 229.9 million, growing 27.71%. Between them, the two took 82.51% of all category traffic.
The leader carried almost all of the net movement. Suno added 219.7 million visits against a category net gain of 222.7 million, close to 99% of the total.
That does not mean everything else stalled. BandLab added 49.9 million visits, and Moises, Lalal.ai, Riffusion, and Hume AI all finished above their prior-year totals, with those gains largely cancelled by losses elsewhere.
The losses were substantial. Udio fell 48.71%, Soundraw dropped 45.11%, and Jammable declined 32.09%, which is what allows a growing category to show almost no net gain outside its leader.
The overall shape is a hierarchy forming. Interest in AI music is rising; the gains are not being shared evenly, and unlike video, where users are still cycling through new options, this category is consolidating around a small group with a clear order.
The table below shows how that hierarchy is taking shape across total visits, year-over-year change, and category market share.
Top 10 AI Music Generator Tools by Total Web Visits in the Last 12 Months (may 2025 – apr 2026)
| Rank | Tool Name | URL | Category | may 2024–apr 2025Sum | may 2025–apr 2026Sum | Change | Change (%) | Market Share (%) |
|---|---|---|---|---|---|---|---|---|
| 1 | Suno | https://suno.com/ | Music Generators | 600.2M | 819.9M | 219.7M | 36.61% | 64.44% |
| 2 | BandLab | https://www.bandlab.com/ | Music Generators | 180.0M | 229.9M | 49.9M | 27.71% | 18.07% |
| 3 | Moises | https://moises.ai/ | Music Generators | 35.2M | 39.7M | 4.5M | 12.80% | 3.12% |
| 4 | Lalal.ai | https://www.lalal.ai/ | Music Generators | 29.5M | 34.8M | 5.3M | 18.11% | 2.74% |
| 5 | Udio | https://www.udio.com/ | Music Generators | 60.5M | 31.0M | -29.5M | -48.71% | 2.44% |
| 6 | Riffusion | https://www.riffusion.com/ | Music Generators | 14.9M | 22.3M | 7.3M | 49.00% | 1.75% |
| 7 | Jammable | https://www.jammable.com/ | Music Generators | 16.9M | 11.5M | -5.4M | -32.09% | 0.90% |
| 8 | eMastered | https://emastered.com/ | Music Generators | 13.2M | 9.7M | -3.5M | -26.61% | 0.76% |
| 9 | Soundraw | https://soundraw.io/ | Music Generators | 11.6M | 6.4M | -5.2M | -45.11% | 0.50% |
| 10 | Hume AI | https://www.hume.ai/ | Music Generators | 3.3M | 6.2M | 2.8M | 85.73% | 0.48% |
9. Top 10 AI Background Remover Tools by Total Web Visits in the Last 12 Months (may 2025 – apr 2026)
Music generators are concentrated around a growing leader. Background removers are more concentrated still, with a leader slowly giving up ground while smaller tools build around it.
The visual ranks the ten most-visited background removers from May 2025 to April 2026 against the previous twelve months. Category visits fell 60.8 million, or 5.13%, from roughly 1.2 billion to 1.1 billion.
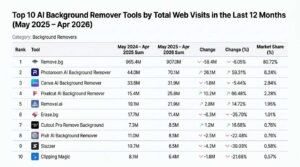
Remove.bg stayed far ahead at 907.0 million visits and 80.72% of category traffic, while losing 58.4 million visits at a 6.05% decline.
The arithmetic makes the category’s decline effectively a single tool’s decline. Remove.bg accounted for 96% of the category’s total loss, dropping 58.4 million of the 60.8 million that left.
Beneath the leader the direction reverses. Photoroom’s AI Background Remover grew 59.31% to 70.1 million visits, Pixelcut rose 66.48% to 25.6 million, and Removal.ai and Cutout.Pro both finished above their prior-year totals.
That produces a more layered picture than a declining category total implies. Background removal is not losing demand. Visits are shifting from a single-purpose destination toward the same capability built into broader image editing products.
The logic is easy to follow from the user’s side. Removing a background is usually one step inside a larger design job, and when one tool removes the background, resizes the image, adds text, builds the product visual, and exports the result, the separate visit stops being necessary. Remove.bg still dominates the category, and the growth now belongs to tools supporting the full workflow.
The table below shows how that shift is developing across total visits, year-over-year change, and category market share.
Top 10 AI Background Remover Tools by Total Web Visits in the Last 12 Months (may 2025 – apr 2026)
| Rank | Tool Name | URL | Category | may 2024–apr 2025Sum | may 2025–apr 2026Sum | Change | Change (%) | Market Share (%) |
|---|---|---|---|---|---|---|---|---|
| 1 | Remove.bg | https://www.remove.bg/ | Background Removers | 965.4M | 907.0M | -58.4M | -6.05% | 80.72% |
| 2 | Photoroom AI Background Remover | https://www.photoroom.com/tools/background-remover | Background Removers | 44.0M | 70.1M | 26.1M | 59.31% | 6.24% |
| 3 | Canva AI Background Remover | https://www.canva.com/features/background-remover/ | Background Removers | 33.8M | 31.9M | -1.8M | -5.44% | 2.84% |
| 4 | Pixelcut AI Background Remover | https://www.pixelcut.ai/background-remover | Background Removers | 15.4M | 25.6M | 10.2M | 66.48% | 2.28% |
| 5 | Removal.ai | https://removal.ai/ | Background Removers | 19.1M | 21.9M | 2.8M | 14.72% | 1.95% |
| 6 | Erase.bg | https://www.erase.bg/ | Background Removers | 17.7M | 11.4M | -6.3M | -35.70% | 1.01% |
| 7 | Cutout.Pro Remove Background | https://www.cutout.pro/remove-background | Background Removers | 7.3M | 8.5M | 1.2M | 16.68% | 0.76% |
| 8 | Pixlr AI Background Remover | https://pixlr.com/remove-background/ | Background Removers | 11.0M | 8.5M | -2.5M | -22.48% | 0.76% |
| 9 | Slazzer | https://www.slazzer.com/ | Background Removers | 10.7M | 6.5M | -4.2M | -39.03% | 0.58% |
| 10 | Clipping Magic | https://clippingmagic.com/ | Background Removers | 8.1M | 6.4M | -1.8M | -21.68% | 0.57% |
10. Top 10 AI Sales Tools by Total Web Visits in the Last 12 Months (may 2025 – apr 2026)
Background removers declined because their leader did. Sales tools follow the same arithmetic, and enterprise buying behaviour makes the interpretation more complicated.
The visual ranks the ten most-visited sales tools from May 2025 to April 2026 against the previous twelve months. Enterprise software typically grows through contracts, seat expansion, and existing customer relationships rather than public discovery, which usually makes traffic shifts here slower and less dramatic than in consumer categories.
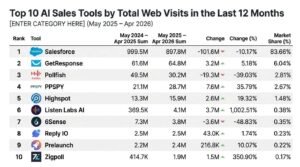
Salesforce led with 897.8 million visits and 83.66% of category traffic, while its annual total fell by 101.6 million, or 10.17%. GetResponse placed second at 64.8 million and Pollfish third at 30.2 million.
The gap between the leader’s loss and everyone else’s gains is decisive. Salesforce shed 101.6 million visits, more than five times the 18.9 million added by all seven growing tools in the top ten combined.
That is why the smaller success stories could not change the direction. PPSPY grew 35.79%, Highspot rose 19.32%, and GetResponse added 5.18%, and none of those gains register against a nine-figure decline at the top.
The fastest growth came from a much smaller tier. Listen Labs AI rose 1,002.51%, from 369,500 to 4.1 million visits, and Zigpoll increased 350.90% to 1.9 million. Impressive rates, negligible market impact.
The decline also needs handling with care. Most Salesforce activity happens inside logged-in products, team accounts, and long-term contracts that generate no public page views, so falling visits describe discovery behaviour rather than usage. What the data does establish is that public traffic to sales tools is not keeping pace with consumer-facing AI categories.
The table below shows how concentrated the category remains across total visits, year-over-year change, and category market share.
Top 10 AI Sales Tools by Total Web Visits in the Last 12 Months (may 2025 – apr 2026)
| Rank | Tool Name | URL | Category | may 2024–apr 2025Sum | may 2025–apr 2026Sum | Change | Change (%) | Market Share (%) |
|---|---|---|---|---|---|---|---|---|
| 1 | Salesforce | https://www.salesforce.com/in/?ir=1 | Sales Tools | 999.5M | 897.8M | -101.6M | -10.17% | 83.66% |
| 2 | GetResponse | https://www.getresponse.com/ | Sales Tools | 61.6M | 64.8M | 3.2M | 5.18% | 6.04% |
| 3 | Pollfish | https://www.pollfish.com/ | Sales Tools | 49.5M | 30.2M | -19.3M | -39.03% | 2.81% |
| 4 | PPSPY | https://www.ppspy.com/ | Sales Tools | 21.1M | 28.7M | 7.6M | 35.79% | 2.67% |
| 5 | Highspot | https://www.highspot.com/ | Sales Tools | 13.3M | 15.9M | 2.6M | 19.32% | 1.48% |
| 6 | Listen Labs AI | https://listenlabs.ai/ | Sales Tools | 369.5K | 4.1M | 3.7M | 1,002.51% | 0.38% |
| 7 | 6Sense | https://6sense.com/ | Sales Tools | 7.3M | 3.8M | -3.6M | -48.83% | 0.35% |
| 8 | Reply IO | https://reply.io/ | Sales Tools | 2.5M | 2.5M | 43.0K | 1.74% | 0.23% |
| 9 | Prelaunch | https://prelaunch.com/ | Sales Tools | 2.2M | 2.4M | 216.8K | 10.07% | 0.22% |
| 10 | Zigpoll | https://www.zigpoll.com/ | Sales Tools | 414.7K | 1.9M | 1.5M | 350.90% | 0.17% |
Momentum Check: The AI Categories and Tools Gaining or Losing Ground
Category size tells us where audiences already are. It says nothing about where they are heading, and those two questions have different answers in this dataset.
A category can hold billions of visits while contracting. A much smaller one can grow fast enough to reshape the competitive picture within a year. Both appear below.
This section compares May 2025 to April 2026 against the previous twelve months to identify which tools and categories added the most visits, which grew fastest in percentage terms, and which lost the most ground.
We report absolute and percentage change separately throughout, because they answer different questions. Absolute change tells you what moved the market. Percentage change tells you what is accelerating. A tool can lead one measure and barely register on the other, and reading them together is the only way to separate genuine scale from early momentum.
Consolidation Signals: How to Tell a Durable Leader From a Spike
Momentum rankings reward whatever moved most recently, which makes them poor predictors on their own. Four tests separate growth likely to hold from growth likely to unwind, and every test can be run against the data in this study.
Test one: does the floor rise, or only the ceiling?
Compare the weakest month of the latest period against the weakest month of the previous one. Copilot’s low moved from 30.0 million to 81.3 million visits, which is a genuine relocation. A tool whose peak rises while its trough stays flat has added attention, not habit.
Test two: how much of the annual gain sits in one or two months? DeepSeek moved from 8.1 million to 520.2 million visits in two months and then settled 40% below that peak. When a small number of months carry most of the increase, the annual growth rate describes an event rather than a trend.
Test three: where did the period end relative to its own peak?
Gemini, Claude, and Suno all closed at or near their highs. Perplexity finished roughly 38% below its October peak while still posting 98.38% annual growth. Exit position is a better leading indicator than annual growth, because it reflects the most recent twelve weeks rather than the average of fifty-two.
Test four: is the category moving in the same direction?
A tool growing inside a contracting category is taking share from rivals. A tool growing inside an expanding category may simply be carried by demand. JanitorAI grew while its category’s other major tool fell, which is a stronger signal than growing alongside everyone else.
Applying all four to the fastest-growing tools in this study produces a clearer picture than any single ranking. Gemini passes all four. Claude passes three and finished at peak with insufficient history to judge durability. Grok passes on floor and category and shows a soft final month. DeepSeek fails tests two and three while passing test one comfortably, which is exactly what a retained spike looks like.
None of these tests predicts the next twelve months with certainty. They do separate the tools whose growth is embedded in recurring behaviour from those whose growth arrived on a wave of attention, and that distinction matters far more than a growth percentage when deciding which platforms to build a strategy around.
1. 10 Most Trending Up AI Tool Categories in (may 2024 – apr 2025) – (may 2025 – apr 2026)
Category rankings show where audiences already sit. Ranking by visits added shows where the market’s new demand actually went.
The visual below orders categories by the absolute number of visits gained against the previous twelve months. That is deliberately different from ranking by percentage, because a large category has the room to add billions while a small one can multiply several times over without approaching the same scale.
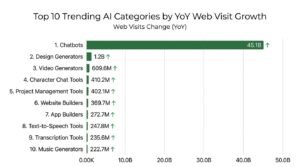
Chatbots did not merely lead. They were the expansion. Visits climbed from 45.1 billion to 86.0 billion, a gain of 40.9 billion at 90.82% growth.
The concentration of growth exceeds even the concentration of traffic. Chatbots took roughly 91% of all visits added across the ten leading growth categories and gained more than 34 times the visits of Design Generators in second place.
The rest of the top five is modest by comparison. Design Generators added 1.2 billion visits, Video Generators 609.6 million, Character Chat Tools 410.2 million, and Project Management Tools 402.1 million.
Further down, a different kind of growth appears. Website builders more than doubled, rising 109.74% from 336.9 million to 706.7 million visits. Transcription tools grew 88.84% and app builders 81.91%.
Those smaller categories will not appear near the top of a visits-added table for some time. They do show where new habits are forming, as people move from asking AI questions toward using it to build sites and apps, transcribe recordings, generate speech, organise work, and produce media.
The market is therefore growing in two layers. Chatbots supply almost all of today’s new visits, while a set of creation and productivity categories expand fast enough to matter considerably more in future rankings than they do in this one.
The table below assembles those gains, ranking the ten categories that added the most visits alongside their absolute growth, percentage growth, and totals.
10 Most Trending Up AI Tool Categories (may 2024 – apr 2025) – (may 2025 – apr 2026)
| Rank | Category | may 2024–apr 2025Sum | may 2025–apr 2026Sum | Change | Change (%) |
|---|---|---|---|---|---|
| 1 | Chatbots | 45.1B | 86.0B | 40.9B | 90.82% |
| 2 | Design Generators | 9.6B | 10.9B | 1.2B | 12.87% |
| 3 | Video Generators | 2.0B | 2.6B | 609.6M | 31.24% |
| 4 | Character Chat Tools | 3.1B | 3.5B | 410.2M | 13.20% |
| 5 | Project Management Tools | 2.2B | 2.6B | 402.1M | 18.55% |
| 6 | Website Builders | 336.9M | 706.7M | 369.7M | 109.74% |
| 7 | App Builders | 332.9M | 605.6M | 272.7M | 81.91% |
| 8 | Text-to-Speech Tools | 669.3M | 917.1M | 247.8M | 37.03% |
| 9 | Transcription Tools | 265.2M | 500.9M | 235.6M | 88.84% |
| 10 | Music Generators | 1.0B | 1.3B | 222.7M | 21.22% |
2. 10 Most Declining AI Tool Categories in (may 2024 – apr 2025) – (may 2025 – apr 2026)
Growth rankings show where visits arrived. This one shows where they left, and the departures cluster far more tightly than the arrivals.
The visual ranks categories by absolute decline against the previous twelve months. Ranking by raw loss rather than percentage keeps the focus on established use cases shrinking at meaningful scale, instead of small categories posting large percentage falls from tiny bases.
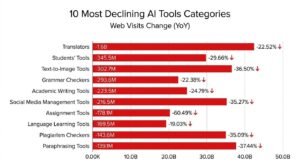
Translators recorded the heaviest loss, falling from 7.3 billion to 5.7 billion visits. That decline of 1.6 billion, or 22.52%, exceeds every other category by a wide margin in absolute terms.
The composition of the list matters more than its leader. Six of the ten fastest-declining categories serve students, writers, or academic work, and together Students’ Tools, Grammar Checkers, Academic Writing Tools, Assignment Tools, Language Learning Tools, and Paraphrasing Tools lost roughly 1.35 billion visits.
The individual figures fill that out. Students’ Tools lost 345.5 million visits, Text-to-Image Tools 302.7 million, Grammar Checkers 293.6 million, Academic Writing Tools 223.5 million, and Social Media Management Tools 216.5 million.
Percentage declines were sharpest lower down. Assignment Tools fell 60.49%, from 294.4 million to 116.3 million visits, the steepest rate on the list. Paraphrasing tools dropped 37.44%, while plagiarism checkers and social media management tools each lost just over 35%.
The unifying pattern is that people have stopped opening a separate site for each narrow task. Translation, grammar correction, paraphrasing, assignment support, and language practice all now run inside broader tools that keep the entire conversation in one place.
None of that means the work stopped. It means the visit relocated, from several specialised destinations to one general one that translates, rewrites, explains, summarises, and answers follow-ups without a tab switch.
Text-to-Image Tools are the exception that proves the point. Their 302.7 million-visit decline has nothing to do with academic work, and it shows creative categories can be absorbed too as users move toward newer image generators or create images inside design tools and chatbots.
The table below assembles those declines, ranking the ten categories that lost the most visits alongside their absolute and percentage changes.
10 Most Declining AI Tool Categories (may 2024 – apr 2025) – (may 2025 – apr 2026)
| Rank | Category | may 2024–apr 2025Sum | may 2025–apr 2026Sum | Web Visits Change (-) | Change (%) |
|---|---|---|---|---|---|
| 1 | Translators | 7.3B | 5.7B | -1.6B | -22.52% |
| 2 | Students’ Tools | 1.2B | 819.2M | -345.5M | -29.66% |
| 3 | Text-to-Image Tools | 829.4M | 526.7M | -302.7M | -36.50% |
| 4 | Grammar Checkers | 1.3B | 1.0B | -293.6M | -22.38% |
| 5 | Academic Writing Tools | 901.6M | 678.1M | -223.5M | -24.79% |
| 6 | Social Media Management Tools | 614.0M | 397.4M | -216.5M | -35.27% |
| 7 | Assignment Tools | 294.4M | 116.3M | -178.1M | -60.49% |
| 8 | Language Learning Tools | 890.5M | 721.0M | -169.5M | -19.03% |
| 9 | Plagiarism Checkers | 409.4M | 265.7M | -143.6M | -35.09% |
| 10 | Paraphrasing Tools | 371.6M | 232.5M | -139.1M | -37.44% |
3. Top 10 Trending Up AI Tools (may 2024 – apr 2025) – (may 2025 – apr 2026)
Category data showed chatbots driving most of the market’s growth. At tool level, that concentration tightens further still.
The visual ranks the ten tools that added the most visits against the previous twelve months. Ranking by visits gained rather than percentage growth identifies which tools actually moved the market rather than which multiplied fastest from a small base.
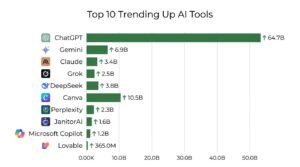
ChatGPT led by a margin that barely fits the chart, adding 26.6 billion visits as its annual total rose from 38.1 billion to 64.7 billion. Gemini followed with 5.6 billion, then Claude at 2.4 billion, Grok at 2.2 billion, and DeepSeek at 2.2 billion.
One tool outweighed the rest of the list combined. ChatGPT’s 26.6 billion gain exceeds the roughly 16.2 billion added by the other nine fastest-growing tools together.
The composition is equally lopsided. Seven of the ten are chatbots, and together they added roughly 40.5 billion visits, about 94.7% of everything gained by the top ten, which is why chatbot performance now effectively sets the direction of the whole market.
This ranking also demonstrates why the two growth measures must be read together. Grok grew 731.26% and Lovable posted the highest rate in the study at 851.55%, yet Lovable added 326.7 million visits against ChatGPT’s 26.6 billion. Both results are genuine. Only one changes the shape of the market.
Non-chatbots did contribute. Canva added 1.4 billion visits as the largest such gain and JanitorAI added 545.6 million, which confirms growth is not confined to general assistants even while the gap remains enormous.
The behavioural reading is consistent across every ranking in this study. New AI visits are flowing toward tools that handle several needs in one place, as people bring writing, research, coding, translation, planning, and everyday questions into a single conversation rather than opening a separate product for each.
The table below assembles those gains, ranking the ten tools that added the most visits alongside both totals, absolute gain, and year-over-year growth.
Top 10 Trending Up AI Tools (may 2024 – apr 2025) – (may 2025 – apr 2026)
| Rank | AI Tool | Category | may 2024–apr 2025Sum | may 2025–apr 2026Sum | Change | Change (%) |
|---|---|---|---|---|---|---|
| 1 | ChatGPT | Chatbots | 38.1B | 64.7B | 26.6B | 69.80% |
| 2 | Gemini | Chatbots | 1.3B | 6.9B | 5.6B | 450.33% |
| 3 | Claude | Chatbots | 958.0M | 3.4B | 2.4B | 250.07% |
| 4 | Grok | Chatbots | 297.7M | 2.5B | 2.2B | 731.26% |
| 5 | DeepSeek | Chatbots | 1.7B | 3.8B | 2.2B | 129.10% |
| 6 | Canva | Design Generators | 9.1B | 10.5B | 1.4B | 15.54% |
| 7 | Perplexity | Chatbots | 1.2B | 2.3B | 1.2B | 98.38% |
| 8 | JanitorAI | Character Chat Tools | 1.0B | 1.6B | 545.6M | 53.14% |
| 9 | Microsoft Copilot | Chatbots | 795.9M | 1.2B | 412.8M | 51.87% |
| 10 | Lovable | Website Builders | 38.4M | 365.0M | 326.7M | 851.55% |
4. 10 Most Declining AI Tools in (may 2024 – apr 2025) – (may 2025 – apr 2026)
The previous ranking showed where visits concentrated. This one identifies the tools those visits left behind.
The visual ranks the ten tools with the largest absolute declines against the previous twelve months. Absolute loss matters more than percentage here, because a modest decline at a very large tool removes far more traffic from the market than a steep fall at a small one.
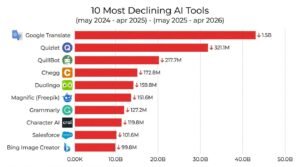
These ten tools shed nearly 3.0 billion visits between them. Google Translate contributed the largest share, falling from 6.2 billion to 4.8 billion, a loss of 1.5 billion at 23.46%.
That single tool dominates the list. Google Translate alone accounts for roughly half of every visit lost across the ten fastest-declining tools.
The rest follow a recognisable pattern. Quizlet lost 321.1 million visits, QuillBot 217.7 million, Chegg 172.8 million, and Duolingo 159.8 million, with six of the ten tied directly to translation, studying, writing, grammar, or language learning.
Percentage declines rank differently. Chegg fell steepest at 61.45%, from 281.2 million to 108.4 million visits, followed by Bing Image Creator at 54.54%, with Quizlet down 29.09% and QuillBot down 25.24%.
The underlying tasks are all still being performed. People continue to translate text, check grammar, learn languages, prepare assignments, and rewrite content in at least the same volumes as before.
What changed is the venue. Someone who once opened four separate sites for translation, paraphrasing, grammar checking, and homework support can now finish all four inside one conversation, and while this dataset cannot trace individual visits to their destination, general assistants gained tens of billions of visits over precisely the period these tools lost theirs.
That explains why the winners and losers look so structurally different. The strongest growth belongs to tools covering many tasks at once, and most of the decline belongs to tools built around a single action.
The table below assembles those losses, ranking the ten tools that lost the most visits alongside both totals, absolute decline, and year-over-year change.
10 Most Declining AI Tools (may 2024 – apr 2025) – (may 2025 – apr 2026)
| Rank | AI Tool | Category | may 2024–apr 2025Sum | may 2025–apr 2026Sum | Web Visits Change (-) | Web Visits Change (%) |
|---|---|---|---|---|---|---|
| 1 | Google Translate | Translators | 6.2B | 4.8B | -1.5B | -23.46% |
| 2 | Quizlet | Students’ Tools | 1.1B | 782.7M | -321.1M | -29.09% |
| 3 | QuillBot | Academic Writing Tools | 862.6M | 644.9M | -217.7M | -25.24% |
| 4 | Chegg | Assignment Tools | 281.2M | 108.4M | -172.8M | -61.45% |
| 5 | Duolingo | Language Learning Tools | 780.7M | 620.9M | -159.8M | -20.47% |
| 6 | Magnific (Freepik) | Image Generators | 2.0B | 1.8B | -151.6M | -7.77% |
| 7 | Grammarly | Grammar Checkers | 823.2M | 696.0M | -127.2M | -15.45% |
| 8 | Character AI | Character Chat Tools | 1.9B | 1.7B | -119.8M | -6.47% |
| 9 | Salesforce | Sales Tools | 999.5M | 897.8M | -101.6M | -10.17% |
| 10 | Bing Image Creator | Text-to-Image Tools | 182.9M | 83.1M | -99.8M | -54.54% |
The Unbundling Effect: Why Single-Task AI Tools Keep Losing Visits
The same pattern recurs throughout this study and deserves a proper mechanism. Translation, grammar checking, paraphrasing, study support, and background removal all lost visits while their category leaders held share, which rules out competitive displacement in every case.
The cause is absorption. A general assistant adds a capability, that capability becomes good enough for most everyday uses, and the visit that previously went to a specialist tool stops happening. The task continues, and the traffic does not.
Four conditions determine which categories get absorbed, and they are visible in this dataset.
Condition one: the task takes seconds and produces text.
Translation, rewriting, and grammar correction all fit inside a chat interface with no interface changes required. Categories built on these tasks lost the most ground of anything we tracked.
Condition two: the output is rarely final.
Someone translating a paragraph usually then edits, summarises, or asks about it. When the follow-up needs a different tool, the tool that handles both wins the whole sequence, which is why translators and paraphrasing tools declined together.
Condition three: quality differences are hard to perceive.
Users switch readily when the specialist’s advantage is not obvious in ordinary use. Professional translation still values precision highly, and casual translation does not, which is why the visit loss concentrated in general-purpose usage.
Condition four: no workflow or asset locks the user in.
Remove.bg is the instructive counter-example. It lost only 6.05% and kept 82.46% of its category, because a background removal is a discrete file operation with an immediate visual result and no conversational follow-up.
Applying those four conditions to the categories still holding up suggests where pressure lands next. Categories with text-based, quick, subjective, unlocked tasks carry high absorption risk. Categories built on file handling, precision output, team data, or a multi-step creative workflow carry considerably less.
That framework reframes several findings in this study. Qualtrics stayed flat because survey research holds team data and structured outputs. Salesforce declined for reasons unrelated to absorption, since its usage sits behind logins. Project management tools grew because AI arrived inside workspaces teams already occupied rather than pulling work out of them.
The practical conclusion for anyone planning around this market is straightforward. Ask whether a tool owns a task or owns a workflow. Tools that own only a task are competing against every general assistant’s next feature release, and this dataset shows what that competition costs over twelve months.
Which Country Has the Highest AI Adoption?
Everything so far has measured tools and categories. Measuring countries introduces a problem the earlier sections did not have.
Total visits track population before they track behaviour. The United States generates far more AI visits than Singapore or the Netherlands, and that gap says more about the number of people online than about how often each of them reaches for an AI tool.
So we calculated visits per 100,000 residents alongside the raw totals.
That single adjustment answers a different question. Total visits identify where the largest AI audience lives. Visits per 100,000 people identify where AI use has become routine, and the two rankings do not agree.
The visual below shows adoption measured against population, which reorders the leaderboard considerably.
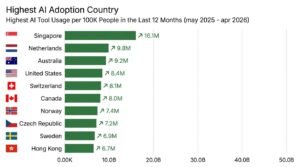
Once population enters the calculation, several smaller countries move ahead of the largest markets. Singapore, the Netherlands, Switzerland, Norway, and Sweden all outrank countries generating many times their raw volume.
Singapore leads clearly. It produced 16.1 million AI visits per 100,000 people, close to double the 8.4 million recorded in the United States. The US still leads on volume at 29.2 billion visits against Singapore’s 950.8 million, and on intensity the order reverses completely.
The size distribution reinforces the point. Seven of the top ten countries have populations below 20 million, which means the deepest adoption is not happening in the largest markets.
This is precisely why volume rankings mislead on adoption. A large population produces a commanding total even where AI use is comparatively uncommon per person, and a small, highly connected population can post modest totals while using AI far more habitually.
The practical reading is that adoption depth and market size are separate variables. Singapore shows what saturation looks like, the United States shows what scale looks like, and a strategy built for one does not transfer to the other.
The table below brings that comparison together, ranking countries by AI visits per 100,000 people alongside population, total visits, adoption intensity, and year-over-year growth.
Which Country Has the Highest AI Adoption? Top 10 Countries with the Highest AI Tool Usage per 100K People in the Last 12 Months (may 2025 – apr 2026)
| Rank | Country | Population | may 2024–apr 2025Sum | may 2025–apr 2026Sum | Visits per 100KPeople | Change(may 2024 – apr 2025) to (may 2025 – apr 2026) | Change (%)may 2024 – apr 2025) to (may 2025 – apr 2026) |
|---|---|---|---|---|---|---|---|
| 1 | Singapore | 5.9M | 726.8M | 950.8M | 16.1M | 224.0M | 30.83% |
| 2 | Netherlands | 18.4M | 1.2B | 1.8B | 9.8M | 601.0M | 50.23% |
| 3 | Australia | 27.2M | 1.7B | 2.5B | 9.2M | 766.9M | 44.15% |
| 4 | United States | 349.0M | 22.1B | 29.2B | 8.4M | 7.1B | 32.33% |
| 5 | Switzerland | 9.0M | 498.7M | 731.1M | 8.1M | 232.4M | 46.59% |
| 6 | Canada | 40.5M | 2.4B | 3.2B | 8.0M | 848.3M | 35.50% |
| 7 | Norway | 5.7M | 323.0M | 424.1M | 7.4M | 101.1M | 31.30% |
| 8 | Czech Republic | 10.5M | 458.6M | 755.5M | 7.2M | 296.9M | 64.75% |
| 9 | Sweden | 10.7M | 526.7M | 735.1M | 6.9M | 208.4M | 39.57% |
| 10 | Hong Kong | 7.4M | 345.7M | 497.7M | 6.7M | 151.9M | 43.94% |
What 144.5 Billion AI Web Visits Mean for Search Marketers
The figures in this study describe an AI market, and they carry direct consequences for organic search. Four of them change how we plan work for clients.
The 4.20% share is the number to plan against. AI tools took 144.5 billion of 3.44 trillion tracked visits. That is large enough to matter and small enough that the overwhelming majority of discovery still runs through conventional web pages, so treating organic search as a solved or dying channel misreads the data badly.
Chatbot growth changes question-level demand, not topic demand. Chatbots added 40.9 billion visits over twelve months while categories built on quick single answers contracted. The practical effect is that thin pages answering one narrow question compete directly against a conversation, while pages carrying depth, structure, original data, and decision support do not.
The unbundling pattern applies to content, not just tools. Every declining category in this study served one narrow task with a shallow output. Content follows the same rule. A 400-word definition page occupies the same competitive position as a standalone paraphrasing tool, and the categories that held up were the ones owning a workflow rather than a step.
Measurement gets harder before it gets easier. This study’s core caveat, that visits miss logged-in, in-app, and API usage, mirrors what happens in analytics when assistant referrals arrive without clean attribution. Anyone judging performance on last-click sessions alone will understate the contribution of research-stage content over the next two years.
For the clients we work with at White Label SEO Service, that changes emphasis rather than direction. Technical SEO still determines whether pages can be crawled, rendered, and understood, and that requirement applies equally to assistants parsing a page and to a search crawler indexing it.
Content strategy carries more weight than it did. Pages that only restate what a chatbot already answers have limited runway, so we prioritise original analysis, structured comparison, first-hand process detail, and the depth that makes a page worth citing rather than summarising.
Authority still functions the way it always has. Link building and consistent local citation work continue to establish which sources deserve trust, and that judgement feeds every ranking and retrieval system that decides what to surface.
The analytics side needs attention now rather than later. Tracking assisted conversions, branded search growth, and direct traffic patterns alongside organic sessions gives a far more honest picture of what content is doing than session counts alone, which is exactly what this study’s own limitations demonstrate.
The Singapore finding carries one more lesson worth taking. Adoption intensity varies enormously by market, so search strategy for a client in a highly saturated market and one in a market still early in adoption should not look identical, and the population-adjusted view is the only way to tell which situation you are in.
AI Predictions for 2026–2027
The country data closes the descriptive half of this study and raises the obvious next question. We cannot forecast the next ranking with confidence, and the direction of travel is legible enough to commit to.
Visits are consolidating around tools that cover more tasks, fit inside existing workflows, and give people a reason to return. Six trends follow from what we tracked between May 2024 and April 2026.
AI Could Soon Claim Close to 10% Market Share of Major Websites’ Visits
AI tools currently hold 4.20% of visits across 10,173 of the largest websites we track. The overall AI market grew 40.12% year over year and the Top 100 grew 49.94%, both far ahead of the wider web’s growth rate. Sustaining even part of that differential moves AI’s share toward 9% to 10% within a few years. ChatGPT reaching fifth place among all tracked websites, from a standing start, shows the pace such a shift can take.
AI Chatbots Will Move From Answers to Full Workflows
ChatGPT, Gemini, and Claude already run research, coding, planning, and multi-step work rather than single exchanges. Chatbots added 40.9 billion visits at 90.82% growth over one year, and that scale of adoption tends to broaden what people attempt inside a tool. We expect the unit of use to shift from the question to the completed task.
More Web Visits Will Concentrate Around Fewer AI Tools
The Top 100 already hold 89.69% of all AI tool visits and grew faster than the market overall, 49.94% against 40.12%. A leading group outgrowing its own market compounds concentration mechanically. As those tools absorb capabilities that previously needed separate sites, the tail loses its reason to exist.
AI Search Will Keep Challenging Traditional Search Habits
Perplexity almost doubled to 2.3 billion visits at 98.38% growth, while Gemini and ChatGPT increasingly handle question-asking, option-comparing, and research that once began with a results page. Answer-first research is clearly established. Whether Perplexity specifically sustains its position is a separate question, given it ended the period well below its own peak.
Creative AI Will Become Less Divided by Format
Some of the sharpest growth came from video, voice, music, and image tools. Higgsfield AI rose 790.59%, Google Veo 3 gained 711.07%, and Suno grew 36.61%. Users juggling separate tools for each format have an obvious incentive to consolidate, and products combining text, image, audio, and video in one workflow are the natural beneficiaries.
Retention Will Matter More Than Novelty
Most capabilities in this market are now available in several places, which makes any individual feature a weak long-term advantage. The durable position belongs to tools people return to for daily work, study, research, and creation. As features become trivial to replicate, recurring use and workflow integration will separate leaders from tools that simply had a strong quarter.
Conclusion:
Across tools, categories, momentum, and country-level adoption, one finding holds throughout. AI use is expanding quickly, and that expansion is gathering around a shrinking group of tools rather than spreading across the market.
The numbers make the point plainly. Our 9,531 tools produced 144.5 billion visits over the latest twelve months, up 40.12%, while the Top 100 took 129.6 billion of them and held an 89.69% share. Growth is real, and most of it is landing on names that were already leading.
ChatGPT illustrates it best. At 64.7 billion visits, it holds 44.76% of the entire market by itself, and Gemini, Claude, Grok, DeepSeek, and Perplexity are all growing fast enough to show the position is contested even if none has closed the gap.
The category view repeats the pattern with a twist. Chatbots now take more than half of all AI tool visits while translators, grammar checkers, academic writing tools, and student tools decline together. Those tasks have not become less useful. They are being completed inside broader tools rather than at their own addresses.
Country data adds the final layer. The United States leads on total volume while Singapore leads on intensity once population is accounted for, which separates where the largest audience lives from where AI use has genuinely become routine.
That leaves a market that is simultaneously large and early. AI accounts for 4.20% of visits across the 10,173 websites in our wider dataset, so the next phase depends less on how many tools launch and more on which ones become part of daily routines, absorb additional use cases, and earn repeat visits.
For anyone planning organic growth around this shift, the practical response is depth over breadth: content worth citing, technical foundations that let it be read, and authority signals that make it trusted. We help businesses, startups, and brands build exactly that at White Label SEO Service, across technical SEO, content strategy, link building, and performance tracking, so get in touch when you want a search strategy built for how people actually find information now.
Methodology:
This study measures how people used AI tools over the past year, based on estimated web visit data across the global AI industry.
We analysed 9,531 AI tools across more than 170 categories, using 24 months of web visit data covering May 2024 through April 2026.
The comparison uses two rolling twelve-month windows, May 2024 to April 2025 against May 2025 to April 2026, rather than calendar years. Rolling windows give the most current read on usage and growth instead of a picture frozen at a year-end boundary.
Web visit data was gathered and analysed using Semrush and Ahrefs, covering:
- Yearly web visits and growth trends
- Market share by tool and by category
- Category-level performance across chatbots, AI search, design generators, image and video generation, coding assistants, translators, education tools, productivity platforms, and customer service AI
For country-level adoption, AI web visits were compared against national population figures to produce visits per 100,000 people.
What this study does not fully capture:
- Mobile app activity
- Private enterprise AI systems
- Offline AI tools
- Newly launched platforms with limited public traffic history
Because this industry moves quickly, rankings and market positions will shift as new platforms launch and usage patterns change.
Limitations and Confidence Levels in This Dataset
Listing exclusions is standard practice. Grading confidence is less common and considerably more useful, because not every figure in a traffic study carries the same weight.
| Figure type | Confidence | How far it can be pushed |
| Relative ranking of large tools | High | Order of the Top 20 is reliable |
| Year-over-year direction | High | Growth and decline directions hold |
| Category totals and shares | High | Comparable across categories |
| Absolute visit counts | Directional | Treat as estimates, not audited figures |
| Month-to-month movement | Directional | Read trends over six months, not single months |
| Percentage growth from small bases | Low | Do not quote without the absolute figure |
| Enterprise tool performance | Low | Logged-in usage is invisible here |
| Country adoption intensity | Directional | Population data and traffic estimates carry separate error |
Three limitations deserve emphasis beyond the table.
Estimates are not measurements. Traffic estimation infers visits from sampled signals, so absolute counts carry meaningful error bars while relative comparisons between tools measured the same way remain sound. That is why this study ranks and compares rather than certifying exact totals.
Enterprise and app-first tools are systematically understated. Salesforce, Copilot, Zoom, and any product whose real work happens after login or inside an application will appear weaker here than their actual usage warrants. Declines in those entries describe public discovery, not adoption.
Percentage growth from a small base tells you almost nothing alone. A tool rising 1,002.51% to 4.1 million visits is a rounding error against a category leader’s monthly figure. Every percentage in this study should be read alongside its absolute number.
Used within those boundaries, this dataset is strong for exactly what it was built to do: comparing public demand across thousands of tools on one consistent basis over 24 months.
Frequently Asked Questions
How many AI tools did this study track?
We tracked 9,531 AI tools across more than 170 categories over 24 months, from May 2024 to April 2026, using estimated monthly web visit data.
What is the most popular AI tool in 2026?
ChatGPT leads with 64.7 billion web visits over the twelve months to April 2026, taking 44.76% of the entire AI tools market on its own.
Does this study measure users or visits?
It measures estimated web visits only. It does not track unique users, subscriptions, revenue, mobile app sessions, or API calls anywhere in the dataset.
Which AI category is growing fastest?
Chatbots added 40.9 billion visits at 90.82% growth, roughly 91% of all gains across the ten leading growth categories in this study.
Why are translation and study tools losing visits?
Those tasks now happen inside general assistants that translate, rewrite, explain, and answer follow-ups in one conversation, removing the need for a separate site visit.