
Google Business Profile Insights are the native performance reports that show how customers find, view, and interact with your business listing across Google Search and Google Maps. Reading them correctly tells you exactly which queries drive visibility, which actions convert, and where local optimization investment delivers the highest return.
For local businesses, agencies, and multi-location brands, GBP Insights is the single most direct line of sight into how Google interprets your relevance, prominence, and engagement signals.
This guide covers what the insights are, how to access them, the metrics they report, how to interpret search queries, customer actions, photo data, messages, integrations, strategy alignment, reporting, and common interpretation mistakes.
What Are Google Business Profile Insights?
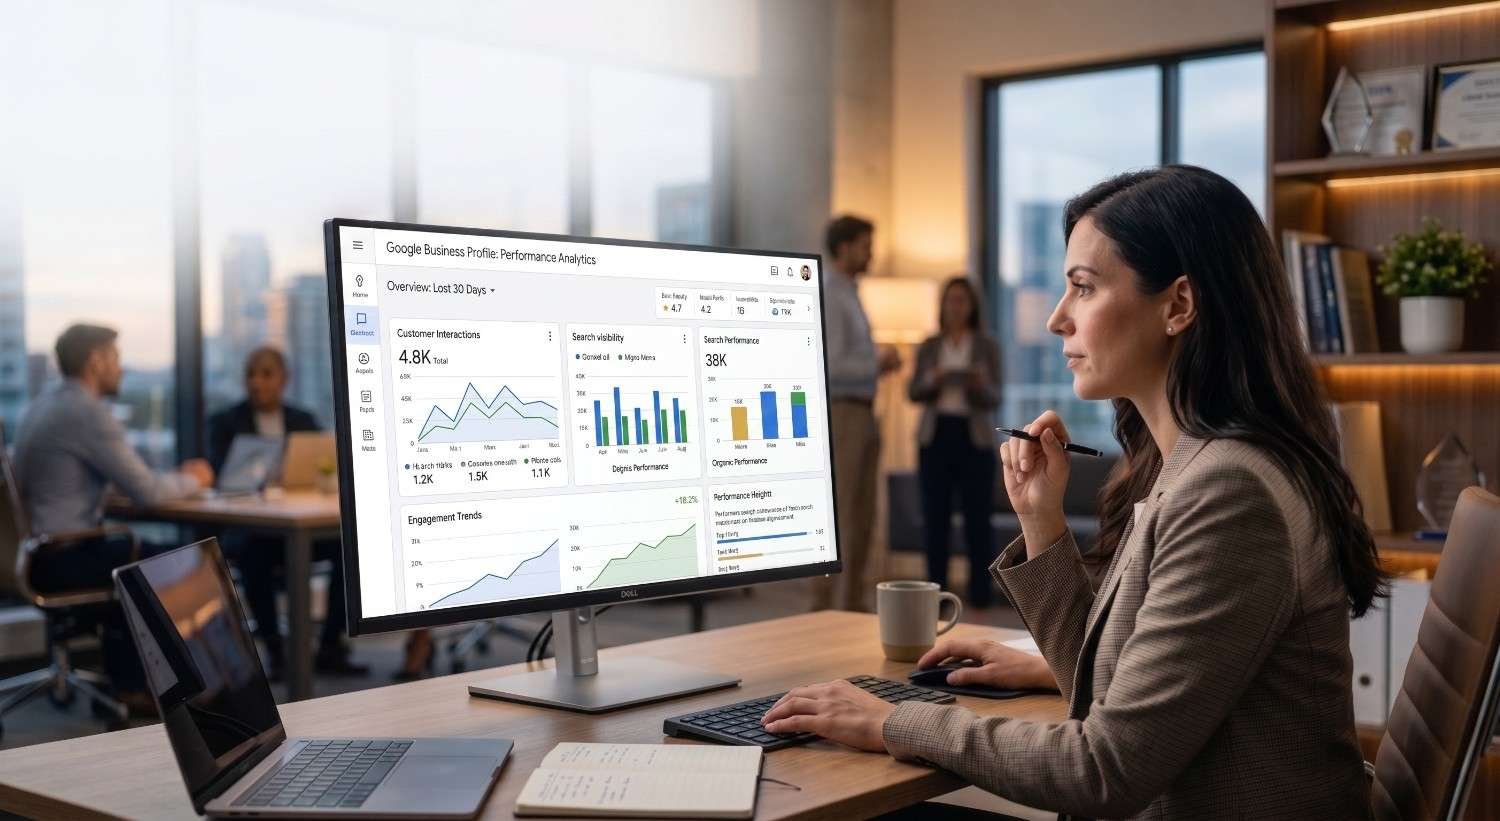
Google Business Profile Insights is the native analytics layer that reports how users discover and interact with your business listing on Google Search and Google Maps. It captures impressions, queries, profile views, calls, direction requests, website clicks, photo views, message activity, and booking actions over rolling time windows.
Insights data is unique because it represents zero-click and pre-click behavior. Unlike Google Analytics, which begins tracking only after a user lands on your website, GBP Insights captures everything that happens inside the search and Maps interface itself. That includes branded searches, category-level discovery, map carousel impressions, and direct profile interactions that never result in a website visit.
For local businesses, this matters because the majority of revenue-driving micro conversions, calls, direction requests, store visits, now happen entirely within Google’s ecosystem. A profile can generate hundreds of monthly conversions without sending a single click to your website. Without reading Insights correctly, that activity is invisible.
GBP Insights also functions as a feedback loop on optimization work. Category changes, photo uploads, posting cadence, review velocity, and Q&A management all produce measurable shifts in metric trends. Used properly, the dashboard becomes the closest thing local SEO has to a real-time experiment log.
How to Access Your GBP Performance Dashboard
GBP Insights now lives inside the new “Performance” view, accessible directly from Google Search when you are signed into the account that manages your business. Search for your business name, click “Performance” on the management toolbar, and the full dashboard opens with date range controls, metric breakdowns, and search query data.
Three access paths exist. Single-location owners typically manage profiles directly through Search or the Google Maps app. Agencies and multi-location operators access Insights through the Business Profile Manager interface or pull data programmatically through the Business Profile Performance API. The dashboard interface displays a rolling six-month window by default, but custom date ranges allow longer-term trend analysis.
Access permissions matter. Owners see the complete dataset including search queries and conversion-level actions, while managers see slightly reduced query visibility. Before relying on insights for decisions, verify that the profile is fully claimed, verified, and that the right team members have the correct role assignments.
Profile completeness directly affects which metrics populate at all. A fully optimized profile produces dramatically richer insights data because Google only surfaces meaningful metrics for businesses that have completed every field, verified ownership, and built consistent engagement, so our complete GBP optimization guide walks through every category, attribute, and verification step required to unlock the full reporting layer.
Key Metrics Inside Google Business Profile Insights
The Performance dashboard reports across three primary metric families: how customers find your profile, what they search to find it, and what actions they take once they arrive. Understanding the taxonomy before interpreting the numbers is critical, because each metric answers a different strategic question.
Profile Interactions
Profile interactions aggregate all measurable engagement events. The core metrics here include calls, messages, bookings, direction requests, and website clicks. Each one represents a discrete conversion event with direct revenue implications. A 20% lift in direction requests, for example, often correlates with a measurable lift in foot traffic for storefront businesses.
Searches Breakdown
The searches breakdown splits all impressions into Direct, Discovery, and Branded categories. Direct searches happen when someone types your business name or address exactly. Discovery searches happen when someone searches a category, service, or product and your profile appears. Branded searches sit between the two, capturing queries that combine your brand with a modifier like “near me” or a city name. The ratio between these three reveals whether your visibility is driven by existing demand or by new category-level discovery.
Platform and Device Splits
Every metric is further broken down by platform (Google Search vs. Google Maps) and device (mobile vs. desktop). Mobile-Maps interactions usually dominate for storefront businesses, while Search-desktop interactions often dominate for service businesses with longer consideration cycles. These splits are what tell you where to invest in profile presentation, mobile photos for Maps, structured descriptions for Search.
Reading these metrics in isolation is rarely useful. The strategic value emerges when you analyze how each category responds to specific optimization activities across multi-month windows.

Search Queries and Discovery Performance
The search queries report shows the exact terms users entered before Google surfaced your profile. This data is the closest thing local businesses have to a direct view of demand vocabulary, and it sits behind almost every meaningful local SEO decision you will make.
Queries are reported as text strings ranked by impression volume. Google aggregates similar variations and filters extremely low-volume terms for privacy reasons, but the visible portion typically covers 70-85% of total impressions. Each query reveals two things: the actual language customers use, and the categories Google currently considers you eligible to rank for.
The strategic interpretation framework breaks queries into four buckets. Brand queries confirm that branded demand exists, but they do not reveal new growth opportunities. Category queries (“emergency plumber”, “italian restaurant downtown”) reveal which service categories Google associates with your profile and where ranking improvements would produce the largest impression lift. Modifier queries (“24 hour”, “near me”, “open now”) expose attribute opportunities you may be missing in your profile setup. Long-tail queries often reveal genuine intent gaps where you appear but should not, or where you should appear but barely do.
The biggest mistake businesses make with query data is reading it descriptively instead of diagnostically. The right question is never “what did people search?” but “which queries should I rank higher for, and what profile changes would move that ranking?”
Search query data only becomes actionable when paired with a structured research process that prioritizes intent, volume, and competition at the city level, and our local keyword research methodology breaks down the complete framework for turning these raw query lists into a ranked keyword strategy.
Customer Actions: Calls, Directions, and Website Clicks
Customer actions are the conversion layer of GBP Insights. Three primary actions are tracked: phone calls placed directly from the profile, direction requests through Google Maps, and clicks through to your website. Some profiles also surface bookings, menu views, or product clicks depending on category configuration.
Each action carries different strategic weight. Direction requests are the strongest store-visit signal for physical locations and correlate closely with actual foot traffic. Phone calls dominate for service businesses where the buying decision happens during the call itself. Website clicks matter most when your site is positioned to convert visitors who need more information before contacting you.
Reading action data requires looking at three dimensions simultaneously. First, the absolute volume tells you whether your profile generates meaningful activity. Second, the action-to-view ratio (actions divided by total profile views) tells you how persuasive your profile is once people find it. A high view count with low actions almost always signals a presentation problem: weak photos, missing attributes, low review velocity, or an inaccurate primary category. Third, day-of-week and hour-of-day patterns reveal demand cycles you can match against staffing and ad scheduling decisions.
Action metrics correlate directly with map pack visibility because Google rewards profiles that drive engagement, and our guide on Google Maps ranking factors explained covers every signal, from proximity and prominence to engagement velocity, that determines whether your profile earns the actions you are measuring.

Photo, Video, and Visual Insights
The photo performance section reports how many times your profile photos and videos were viewed, split between owner-uploaded and customer-uploaded content. For visual-heavy categories like restaurants, salons, hotels, and retailers, photo metrics often outweigh every other engagement signal in determining profile attractiveness.
Two patterns matter most. First, the gap between owner and customer photo views. If customer photos significantly outperform owner photos, the profile is under-presenting itself; uploading higher-quality, well-categorized owner photos typically lifts conversion ratios within 30-60 days. Second, the volume of photo views compared to total profile views. A healthy ratio sits around 30-50% for service businesses and 70%+ for visual-category businesses.
Photos also influence which queries surface your profile, because Google uses image content as an additional relevance signal alongside category and description data.
Visual content drives a measurable share of profile views and customer actions, but most businesses upload images without a structured plan, which is why our GBP photo optimization best practices <!–NEW PAGE NEEDED–> guide walks through file naming, geotagging, posting cadence, and the photo categories that generate the highest engagement lift.
Messages, Bookings, and Review Engagement
Messages, bookings, and review activity sit in a separate engagement layer because they represent direct two-way communication rather than passive impression or click data. Each one is also weighted heavily in Google’s local ranking algorithm.
Messaging metrics report inbound message volume, response rate, and average response time. Google publicly displays response time on the profile itself, and slow response patterns visibly suppress conversion. Booking metrics, where available, report appointments initiated through integrated providers like Reserve with Google. These are pure-conversion events with no friction between intent and action.
Review activity does not appear in the same Performance dashboard, but review velocity, average rating shifts, and response rates all show up in adjacent reporting views. The strategic interpretation is always relative: a business gaining 12 reviews per month while competitors gain 3 will see compounding ranking gains regardless of absolute review counts.
Review velocity, sentiment, and response speed all feed back into engagement metrics and ranking signals, and our managing customer reviews framework covers the response templates, reporting flows, and reputation workflows that turn review data into a measurable ranking input.
Connecting GBP Insights with GA4 and Search Console
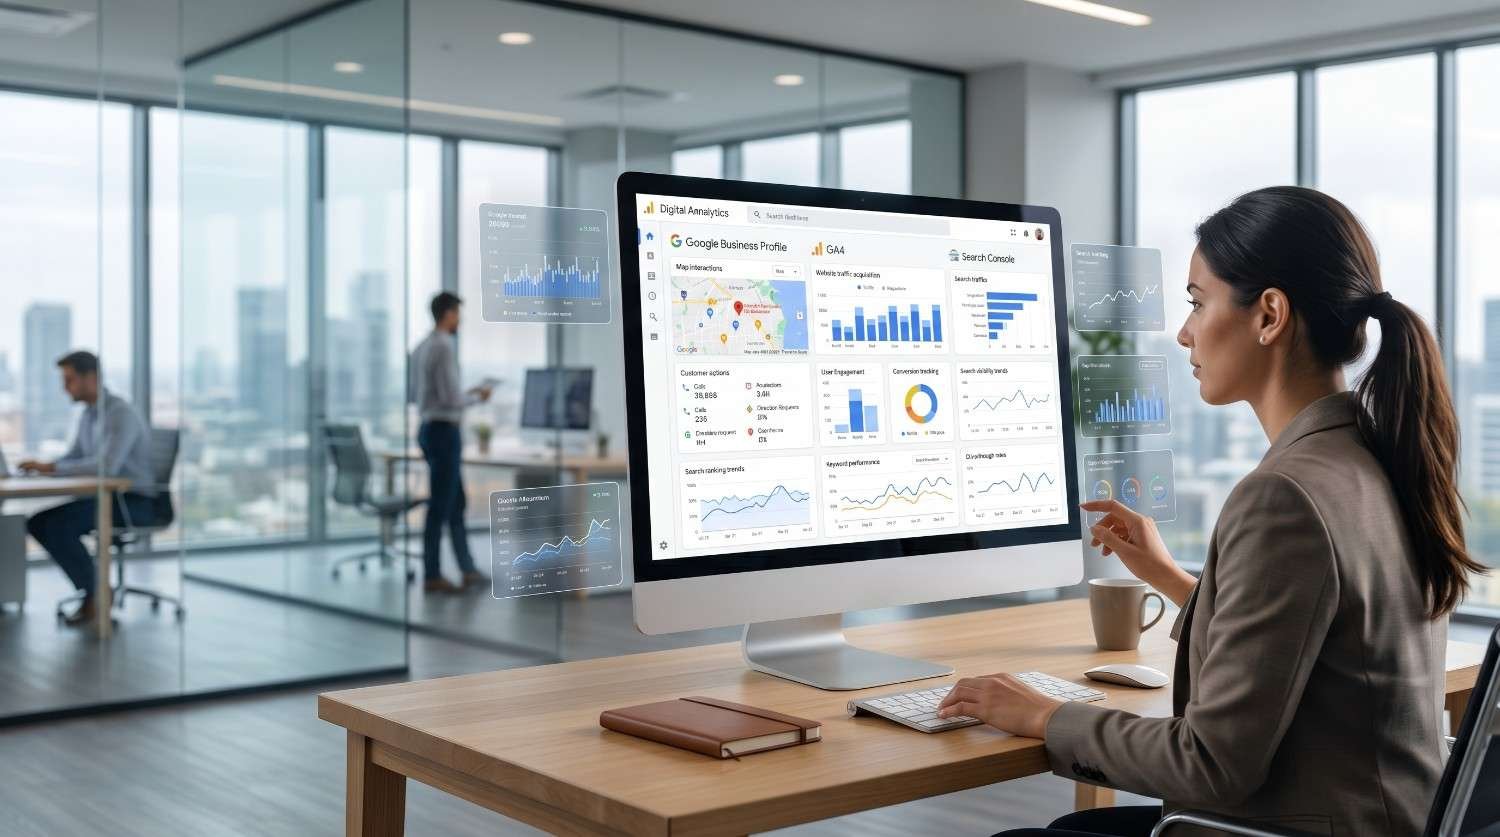
GBP Insights captures the discovery and action layer, but it cannot tell you what users did after they reached your website, what revenue those sessions generated, or how local queries fit into your full organic search footprint. Connecting Insights data to GA4 and Search Console closes those gaps.
The integration begins with UTM tagging. Every profile URL, including the primary website link, appointment URL, and menu URL, should be tagged with consistent source, medium, and campaign parameters. Once tagged, GBP traffic shows up as a distinct channel inside GA4, and you can attribute conversions, revenue, and session quality back to specific profile entry points.
Closing the loop between profile views and actual website behavior requires properly tagged UTM parameters and a configured analytics property, and our GA4 setup for SEO reporting guide walks through event configuration, conversion mapping, and the dashboards that connect GBP traffic to revenue.
Search Console adds a second analytical layer. While GBP shows queries that surfaced your profile, Search Console shows queries that surfaced your website organically. Cross-referencing the two often reveals high-intent queries where your profile ranks but your site does not, or vice versa, both of which are immediate optimization opportunities.
Search Console reveals which organic queries trigger your branded and category impressions across the broader web, and our Google Search Console complete guide explains how to cross-reference GSC query data with GBP search terms to identify the queries driving local discovery.
Turning Insights Into a Local SEO Strategy
Insights data is observation. Strategy is what you do with it. The transition from reading the dashboard to running a structured optimization program follows a repeatable four-stage loop.
Stage 1: Diagnose. Identify the single weakest link in your discovery-to-conversion chain. If discovery searches are low, the problem is category coverage or geographic relevance. If discovery is high but actions are low, the problem is profile presentation. If actions are high but website conversions are low, the problem sits on your site.
Stage 2: Hypothesize. Translate the diagnosis into a specific, testable change. “Add three secondary categories that match top discovery queries.” “Upload 15 high-quality interior photos by category.” “Increase review request cadence from monthly to weekly.” Each hypothesis must be tied to a measurable metric and a realistic time window.
Stage 3: Execute. Make the change, document the exact date, and let the data normalize. Most GBP changes take 14-45 days to show measurable impact, with some category and citation-related changes taking longer.
Stage 4: Measure and iterate. Compare the post-change window against the pre-change baseline. Use the same metric, the same date-range length, and the same platform/device split to ensure clean comparison. Successful changes get scaled; unsuccessful ones get retired without sentiment.
Insights data only creates returns when it feeds into a structured optimization roadmap covering citations, on-page signals, and link acquisition, and our complete local SEO strategy guide walks through every layer of the local ranking system so you can turn dashboard observations into ranking gains.
Reporting and Tracking GBP Performance Over Time
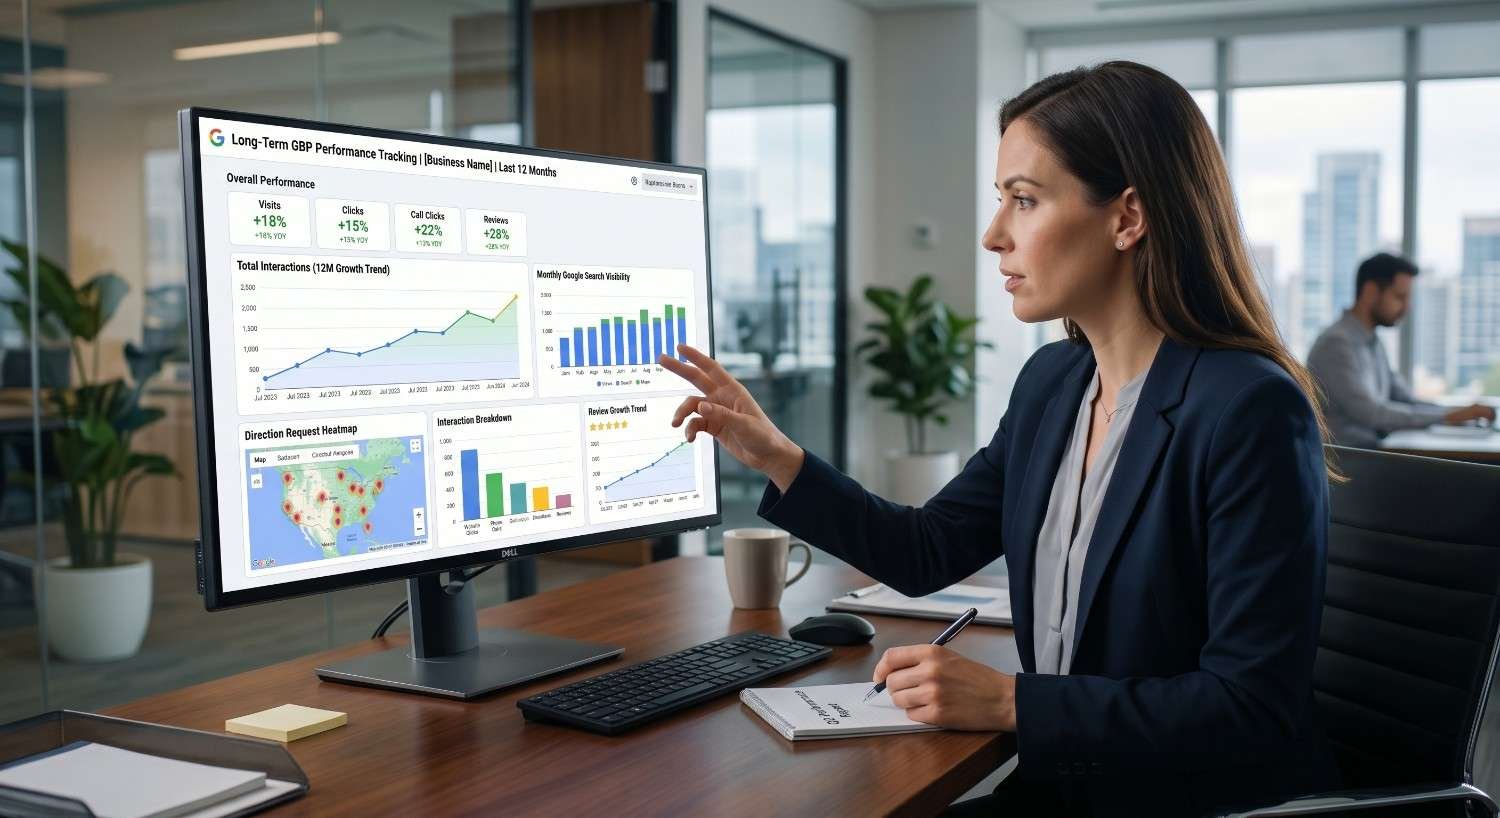
GBP Insights surfaces a rolling six-month window by default, which is too short for meaningful trend analysis. Serious tracking requires exporting data into a persistent reporting system that holds 12-24 months of history at minimum.
The right reporting structure tracks five core KPI groups: total profile views by source, total actions by type, action-to-view conversion ratio, top 25 search queries by impression volume, and review velocity with average rating. Each KPI is tracked month-over-month and year-over-year, with annotations for major optimization events, algorithm updates, and seasonal patterns.
For agencies and in-house teams, the goal is to translate raw dashboard data into a board-readable narrative: what changed, why it changed, what we are doing next, and what we expect to see. That narrative is what justifies continued local SEO investment.
Month-over-month tracking requires standardized reporting formats so trends are visible across long time horizons, and our local SEO reporting templates <!–NEW PAGE NEEDED–> resource provides the dashboards, KPI hierarchies, and client-ready report structures that turn raw insights exports into board-level performance narratives.
Common Mistakes When Reading GBP Insights Data
Even experienced marketers misread Insights data in predictable ways. Five mistakes account for most interpretation errors.
Mistake 1: Confusing impressions with reach. A high impression count does not mean high audience reach. Branded searches inflate impressions without reflecting new demand capture.
Mistake 2: Reading metrics in isolation. A 40% drop in calls is meaningless without knowing whether profile views also dropped 40% (a visibility problem) or stayed flat (a conversion problem).
Mistake 3: Comparing against the wrong baseline. Year-over-year comparisons matter more than month-over-month for seasonal businesses. Mixing these creates false alarms and missed wins.
Mistake 4: Ignoring platform splits. Mobile-Maps performance and desktop-Search performance respond to completely different optimization levers. Aggregate metrics hide the actual leverage points.
Mistake 5: Reacting to weekly noise. GBP data carries high variance week to week. Rolling 28-day or 90-day averages produce decisions that age well; weekly reactions almost never do.
For businesses that need faster, more accurate interpretation of GBP data without building an in-house analytics function, our done-for-you local SEO services manage the full reporting and optimization cycle so every insight translates directly into ranking and revenue improvements.
Conclusion
Google Business Profile Insights connects discovery queries, profile interactions, and customer actions into one diagnostic view of how Google treats your local visibility.
The dashboard becomes strategically valuable only when paired with persistent reporting, integrated analytics, and a structured optimization loop that converts observations into ranking and revenue gains.
We help local businesses, agencies, and multi-location brands turn GBP data into measurable growth at White Label SEO Service, delivering the analytics, strategy, and execution layer your local SEO program needs.
Frequently Asked Questions
What is the difference between Google Business Profile Insights and Google Analytics?
GBP Insights tracks behavior inside Google Search and Maps before a website visit happens. Google Analytics tracks behavior on your website after a click. Together they cover the full local customer journey.
How often does Google Business Profile Insights update?
Most metrics update daily with a 24 to 48 hour delay. Search query data and some aggregated reports can take up to 72 hours to refresh fully inside the Performance dashboard view.
Can I export Google Business Profile Insights data?
Yes. The Performance dashboard offers direct CSV exports for queries, calls, messages, and core metrics. Agencies and multi-location brands can also pull data programmatically through the Business Profile Performance API.
Why are some search queries hidden in my Insights report?
Google hides low-volume queries for user privacy. The visible queries typically represent 70 to 85 percent of total impressions, while hidden ones are individually small and grouped under aggregated reporting categories.
How long does GBP Insights data stay accessible?
Performance data is available for a rolling six month window inside the native dashboard. Longer term retention requires exporting data monthly into a persistent reporting system or third party analytics tool.
Do GBP Insights metrics influence local ranking directly?
The metrics themselves do not rank you, but the underlying signals they measure, engagement, actions, review velocity, photo activity, all feed Google’s local ranking algorithm and prominence calculations.
What is the most important GBP Insights metric to track?
For most local businesses, the action-to-view conversion ratio is the single most diagnostic metric. It reveals whether your profile actually persuades the audience your visibility is already attracting.

